🤖 AI Diabetes Coach series:
— 🚀 Part 1: The Transformation
— 🏗️ Part 2: System Architecture
— 💭 Part 3: Prompt Engineering
— 🕸️ Part 4: Knowledge Graph
➔ 🔧 Part 5: Build Your Own (this post)
— 🍴 Part 6: Teaching Your AI Coach to Cook
You've read about what's possible. Maybe you've tried asking Claude about your glucose data and got something useful. But at some point the question shifts from "could this work?" to "how do I actually start?" — and that's where most people get stuck.
This post is for readers at different technical levels. Remember, you don't need to build everything at once; in fact, it's better to evolve your system as you go based on your actual experience.
Who This Is For
This post is intended for multiple audiences—people with diabetes (or not), PKM practitioners, developers (technical), or others wanting to learn more about health, AI, and technology, or simply have a general non-technical interest.
- People with diabetes (type 1 or 2): who are frustrated with fragmented data that does not provide an integrated view with what you need to know and do. They just want to track and manage diabetes better and take actions that help improve their health every day.
- PKM practitioners: who want to integrate health information in their personal knowledge system.
- Developers: who want a starting point to create a custom system for themselves (or others).
- Non-developers: who are curious, interested, and just want to know what's possible.
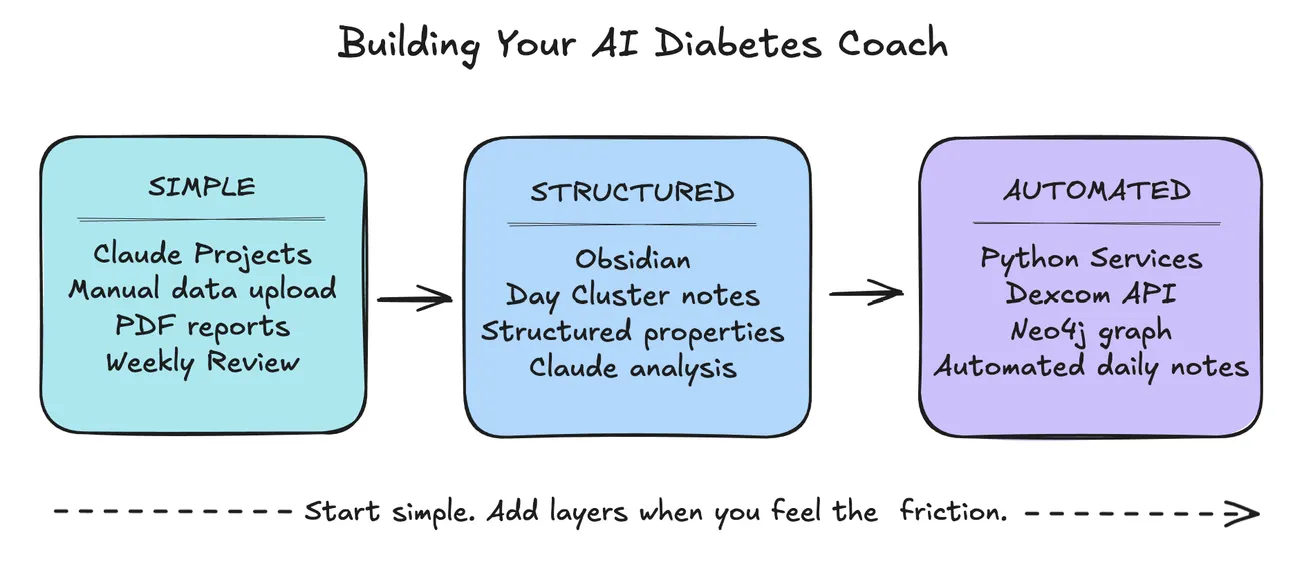
The Spectrum of Approaches
There are various ways to address this topic along the spectrum at different implementation levels:
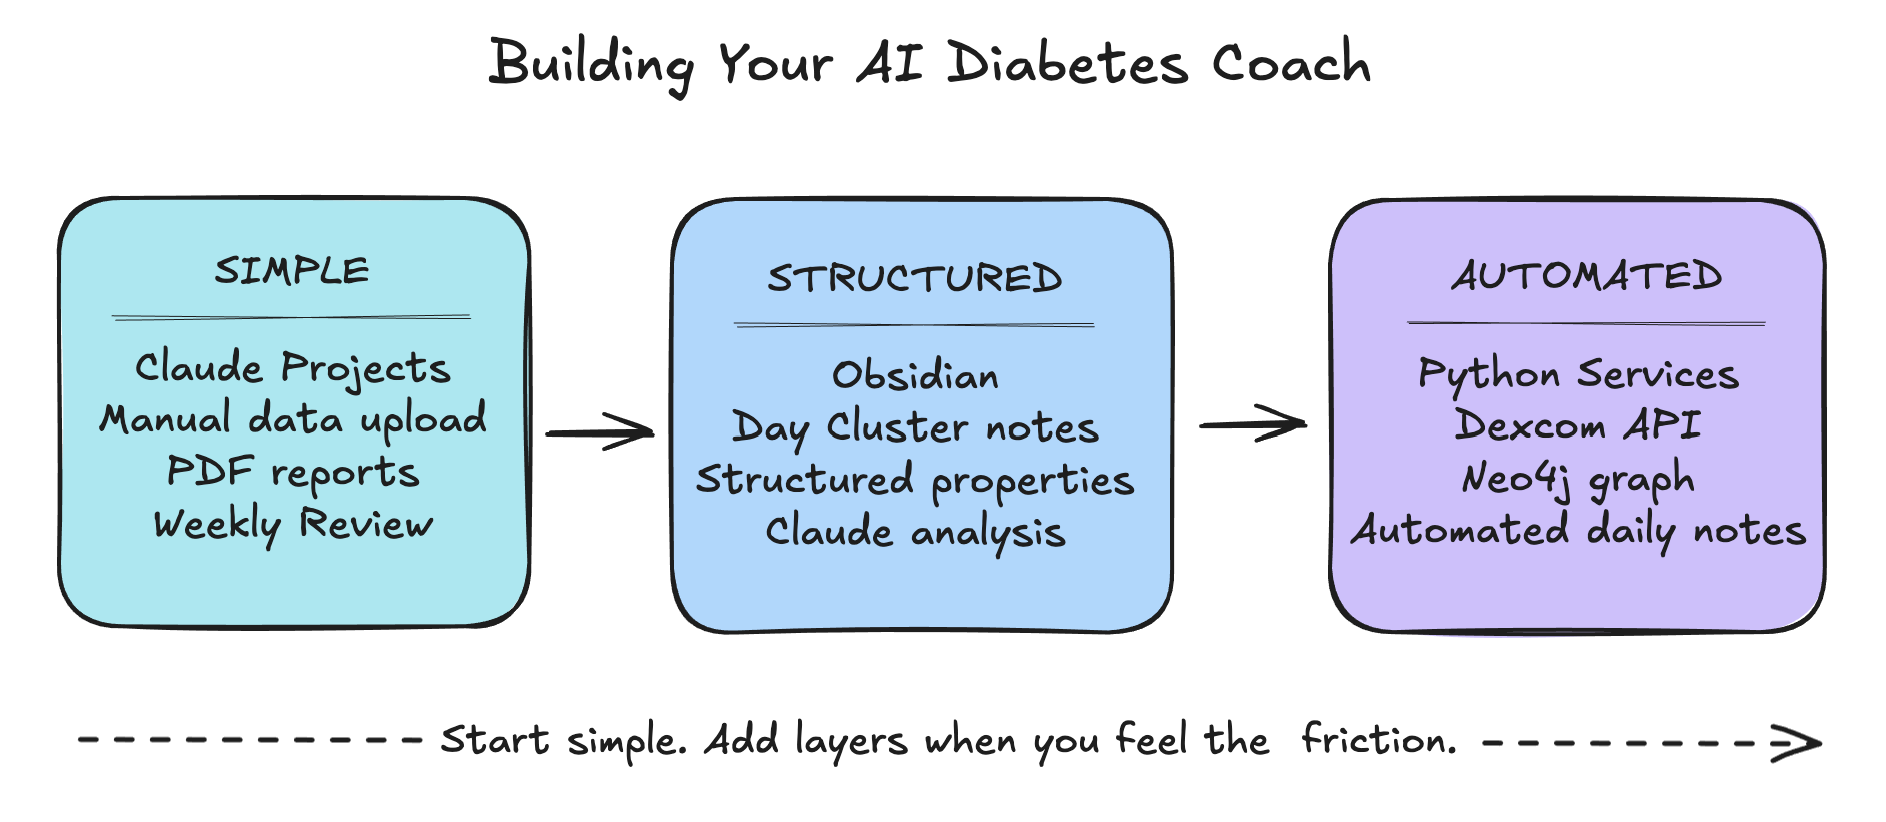
- Simple: Claude Projects + manual data upload.
The easiest way to get started — upload a PDF report and ask Claude what it notices. - Structured: Obsidian + Day Cluster notes + Claude.
Add structure when you want your data to compound over time into queryable patterns. - Automated: Python services + Neo4j + Dexcom API.
Full automation — daily notes generated without you thinking about it.
Start Where You Are
First, you need to begin with your own personal situation, what you know (and don't know), what devices you have (CGM, pump, phone), what apps are you using, how comfortable are you with technology, etc.
- Devices: What do you have? This includes:
- Blood glucose meter (BGM)—Contour Next, AccuChek, or One Touch Verio Flex
- Continuous glucose monitor (CGM)—Dexcom G7, Freestyle Libre, etc.
- Insulin pump for automated insulin delivery—OmniPod 5, Tandem t:slim X2 or Mobi, etc.
- Mobile phones—iPhone (iOS), Samsung (Android), or other
- Computers (laptop or desktop)—macOS, Windows, or Linux
- Smart watch—Apple Watch and others
- Apps: What apps, websites, or databases do you already use? Usually devices have associated mobile apps, and related websites with diabetes data available via API, CSV exports, and/or PDF reports such as these:You might also have other apps with health information. Some may have both mobile and computer versions of their apps.
- BGM: Contour, One Touch Reveal, etc.
- CGM: Dexcom G7 (and Clarity), Tidepool, etc.
- Insulin: Omnipod 5, Glooko, Tidepool, and more
- Websites: Dexcom Clarity, Glooko, or Tandem Source
- Apple Health, Sugarmate, Glucomate, GlucoSense, enhance-d, etc.
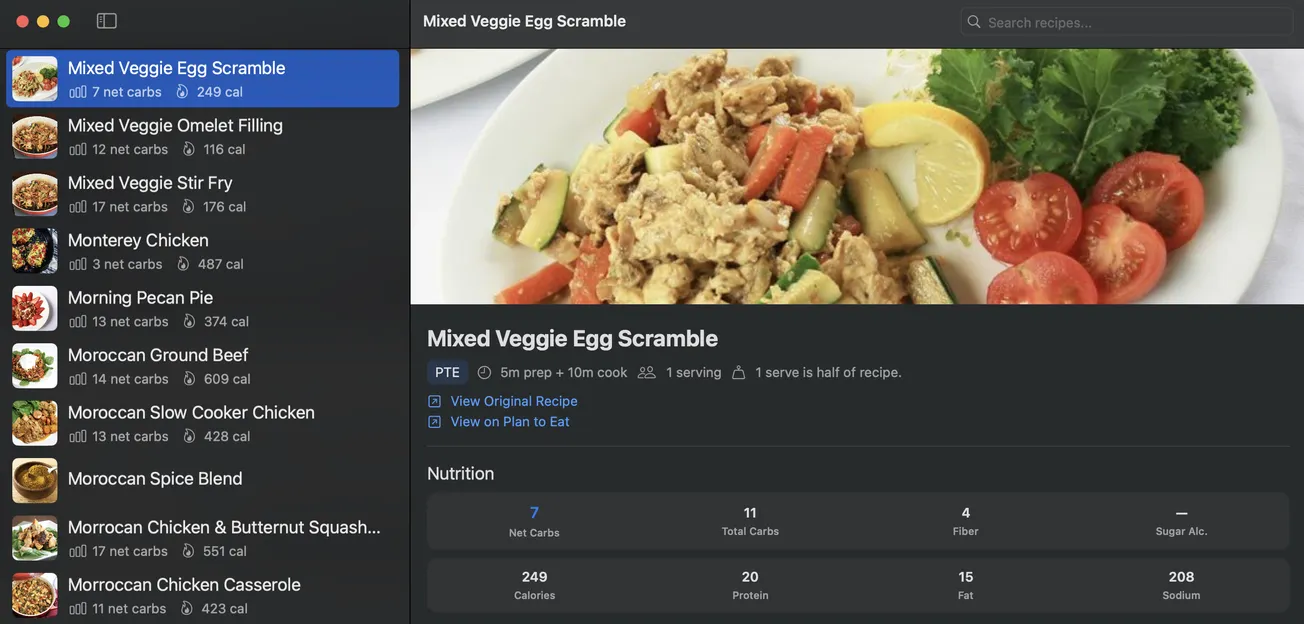
- Recipes: Diabetes Meal Plans (DMP), Plan to Eat (PTE), Paprika
- Meals & nutrition: Under My Fork, Chronometer, SNAQ Diabetes Food Tracker, Mela, FoodNoms
- Sleep—Sleep Cycle
- Mindfulness—Calm or Headspace
- Workout or Fitness—MyFitnessPal, etc.
- Weight & nutrition—Lose It!, etc.
- Technology: Are you comfortable with technology? Do have minimal, basic, or more advanced skills with apps, shortcuts, hotkeys, tools, notes, databases, and websites. This will also determine how you want to proceed, whether tiny experiments, a complete custom system, or anywhere in between.
The Minimal Viable Coach
The simplest version of an AI diabetes coach requires nothing more than Claude and a willingness to share some of your data. No API access, no Python, no special tools.
Start by creating a Claude Project specifically for diabetes. In the Project instructions, add context about yourself: your diabetes type, devices you use, your target ranges, and any patterns you've already noticed. This becomes Claude's persistent memory — it knows your situation before you say a word.
A detailed guide to setting up your Claude Project for diabetes — including sample instructions, prompts, and workflows — is coming as a companion post.
Then export a week of data from whatever app you use. Dexcom Clarity offers a PDF report. Glooko does too. Upload it to Claude and ask: "What patterns do you see in my glucose data this week? What times of day am I most often out of range?"
You'll be surprised what comes back. Not because Claude is magical, but because having an informed, patient analyst look at your data with fresh eyes — even once a week — surfaces things you've stopped seeing because you're too close to it.
The key is consistency. One upload tells you something. Twelve uploads over three months tell you something you can act on.
Adding Structure
Once you're getting value from Claude conversations, structure makes that value compound.
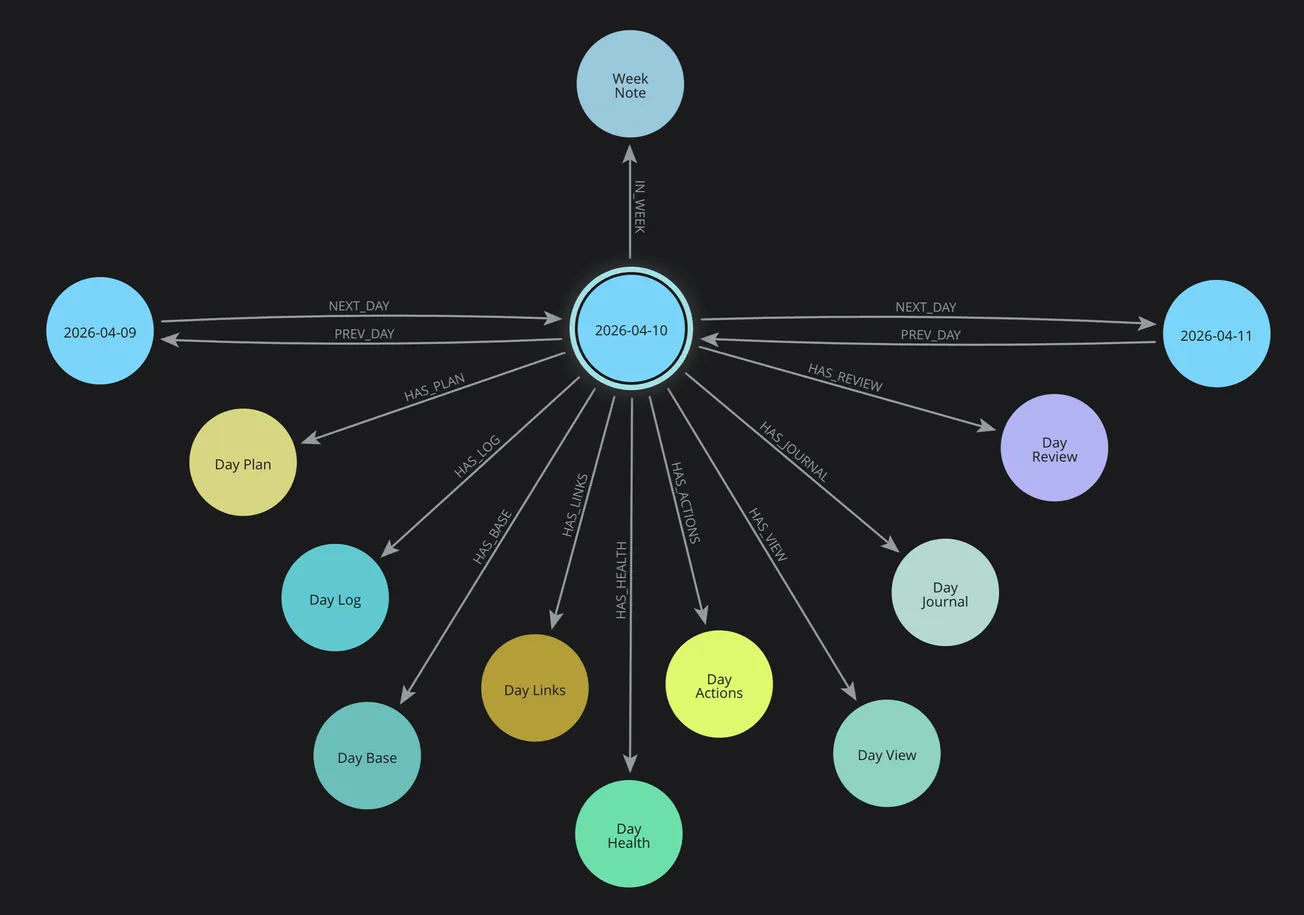
The Day Cluster approach I described in the Day Cluster series gives each day a consistent home — a set of linked notes covering your plan, log, health data, and review.
For diabetes specifically, a daily health note with consistent properties (average glucose, TIR, meals, insulin) becomes queryable over time.
Obsidian is the foundation because it stores everything as plain Markdown files you own and control — no vendor lock-in, no subscription required for your own data.
The Data Layer
Your data is already being collected — the question is whether you can access it.
Dexcom offers a personal API (apply at developer.dexcom.com) that provides raw glucose readings, alerts, and events. Approval took me several weeks.
Glooko aggregates insulin and meal data and offers PDF and CSV exports.
If you're waiting for API access, PDF exports from Clarity or Glooko are a perfectly good starting point — Claude can read and analyze them directly.
The goal is getting your data out of app silos and into a form you control.
The Knowledge Graph (Optional but Powerful)
This is the layer most people will never need — and that's fine.
A Neo4j knowledge graph becomes valuable when you have months of structured data and want to ask questions that span time:
- "What's my average TIR on days after poor sleep?"
- "Which meals consistently produce the flattest glucose response?"
Start without it. Add it when you feel the friction of not being able to query across your history.
Part 4 of this series covers the knowledge graph in detail, if you want to know more about that.
The AI Layer
Claude Projects is the right starting point for most people — persistent context, file uploads, and conversation history across sessions.
Claude Code is worth exploring if you're comfortable with the command line and want AI assistance writing or improving your own scripts and services.
For diabetes coaching specifically, the most valuable prompts are pattern-focused:
- "What changed this week compared to last week?"
- "Given this meal and this glucose response, what would you adjust?"
The Morning Review workflow — uploading yesterday's data each morning and asking for observations — is where the daily value lives.
Lessons Learned
Building this system while living with diabetes has taught me things I couldn't have learned any other way.
What worked: Automating the boring parts. The most valuable thing the system does is generate a structured Day Diabetes note every morning without me thinking about it. That consistency — 135 days of structured data — is what makes pattern analysis possible. You can't find patterns in data you didn't capture.
What didn't work at first: Trying to build everything at once. The system you see in this series evolved over months of tiny experiments. The knowledge graph came after the daily notes. The Python services came after manual workflows. Each layer was added only when I felt the friction of not having it.
The sensor drift problem: CGM sensors aren't always accurate, especially in the first few days of a new sensor. I learned to always check a calibration reading before trusting a concerning number. My system now captures calibration events alongside alerts, so I can see in the morning review when a "low" was actually a false reading.
Typos and autocorrect: Meal names logged in the Dexcom app sometimes arrive misspelled — Cauliflower becomes "Caukiflower," Celery becomes "Cekery." The system captures what was typed, and I correct it in context. A slightly misspelled meal name is still useful data.
Building while living in it: This is both the hardest and most valuable part. Every pattern I've discovered — dawn phenomenon, stress-induced highs, the Panera crouton problem — came from having data at hand when the moment happened. You don't need a perfect system. You need a consistent one.
Getting Started This Week
You don't need to wait until the system is perfect to start getting value from it.
Day 1: Create a Claude Project. Add your diabetes context in the instructions — type, devices, target ranges, current challenges. Upload this week's Clarity or Glooko PDF. Ask Claude what it notices.
Day 3: Try your first structured note. Even a simple daily log — glucose range, meals, how you felt — gives Claude something to work with over time.
Week 2: Explore what data your apps can export. Most CGM and pump apps offer CSV or PDF exports. Find out what format your data comes in.
Month 1: Look back at four weeks of notes. Ask Claude: "Based on my logs, what's the most consistent pattern in my glucose data?" The answer will surprise you.
The goal isn't a perfect system on day one. It's a slightly better view of your own data than you had yesterday.
What's Next
Part 6 covers Recipes, Meals, and Nutrition Intelligence — connecting your food choices directly to glucose outcomes. And a companion guide to Claude Projects setup for diabetes is also in progress.
- 🍴 Part 6: Teaching Your AI Coach to Cook — How food choices connect directly to glucose outcomes — building a recipe intelligence system that learns from your actual responses.
- 📋 Claude Projects Setup Guide for Diabetes — A practical companion guide to setting up your Claude Project — sample instructions, prompts, workflows, and tips for getting the most from your AI diabetes coach.
The PKM structure that organizes all this data for each day is covered in Part 1 of a separate series: 📅 Day Cluster .
Start from the beginning: 🚀 Part 1: The Transformation
