🤖 AI Diabetes Coach series:
— 🚀 Part 1: The Transformation
— 🏗️ Part 2: System Architecture
— 💭 Part 3: Prompt Engineering
➔ 🕸️ Part 4: Knowledge Graph
— 🔧 Part 5: Build Your Own
— 🍴 Part 6: Teaching Your AI Coach to Cook
Imagine describing your diabetes history to a new doctor — every appointment, from scratch. Your basal rates, your patterns, what spikes you, what doesn't. Now imagine doing that at the start of every AI conversation.
When I first started using AI chat conversations for my diabetes management, I realized I was starting each session at zero — re-explaining my glucose data, meals, insulin history, activity, and patterns every single time. No memory, no continuity.
It reminded me of conversations with my mother, who had Alzheimer's disease — like talking to someone with amnesia: no past, no future, no thread connecting one conversation to the next. Talking to an AI without memory felt the same way: you could have a meaningful exchange, but it evaporated. Nothing carried forward.
A truly knowledgeable diabetes coach would know my history after years of working together — my patterns, my triggers, what's improved and what hasn't. AI could be that coach. If only it could remember.
This morning, I was writing this post while my system was simultaneously capturing my glucose, meal, and insulin data. Tomorrow, during my Morning Review, I'll open my Day Diabetes note and see analysis and insights explaining what happened, when, how, and why — along with actions to improve. I'm building the system while living in it.
That's what this series is about: giving AI the memory and context it needs to become a genuine health partner — not a brilliant stranger you have to re-introduce yourself to every time.
The Memory Problem
Managing Type 1 diabetes means living inside an endless stream of data — glucose readings every 5 minutes, insulin doses, meals, exercise, sleep, stress. The challenge isn't collecting the data. It's making sense of it over time.
There are several dimensions to this problem.
AI Conversations
Artificial intelligence chat conversations can be helpful because Large Language Models (LLMs) can read and understand language and generate structured and organized responses in various formats and styles.
If you have a specific question (and provide relevant context) as AI input, you'll probably get useful output from the AI model for that prompt along with related sources and suggestions. This enables an interactive conversation where you can dive deeper on a specific topic or explore related concepts in an ongoing dialog.
However, it's critical that you provide context and instructions with each prompt. And here's the fundamental problem: most AI conversations have no memory across sessions.
Without persistent memory, you either have to keep repeating the same context and instructions for every interaction — or upload the same background documents over and over again.
Both context and memory are essential if you want to find patterns and generate broader insights rather than just answering one-off questions.
Finding Patterns
Diabetes patterns don't reveal themselves in a single day. They emerge over weeks: a glucose spike every Thursday after lunch, a low every morning when you've slept less than 6 hours, a consistent post-exercise dip 90 minutes after a workout.
Scrolling back through daily notes or exports to find these patterns is tedious and unreliable. You miss things. You forget what you were looking for. The signal gets lost in the noise of day-to-day variation.
What you need isn't more data — it's a smarter way to query the data you already have.
Diabetes Analysis
My PKM health services already process all the rich diabetes data captured by my devices, apps, and websites—Dexcom CGM readings via their API, insulin doses from Glooko PDF parsing, meals and carbs from my daily Health notes.
Since there's so much diabetes data, it can be quite overwhelming and hard to understand what's happening, why, and what I can do about it. However, it's not necessary for me to review all the detailed diabetes events or standard diabetes report summaries.
My PKM system automatically generates a single Day Diabetes note every morning that integrates all my diabetes together in context for my Review practice. This has been extremely useful so far because it brings all my diabetes information together for the previous day.
It includes glucose charts, time in range, and summary statistics; insulin and meal summary tables, alert and calibration analysis; day period analysis (night, morning, afternoon, evening), and hourly breakdowns for each 6-hour period with CGM summaries and associated event timelines.
This provides me a wonderful diabetes summary, analysis, and insights for the Morning Review for my Health and Diabetes every day. It definitely helps me understand what's working, what's not, and highlights actions for better health.
Currently, in AI chat conversations using Claude Projects, I can engage with my Claude AI diabetes coach to explore and understand my Day Diabetes day through a series of interactive dialogs during my Morning Review process.
These interactions in context with my diabetes data enables me to make additional Obsidian notes from my learnings, suggestions, protocols, checklists, and actions for my Health area and Diabetes topics, as well as new tiny experiments. I can change my behavior today, and make improvement to my system and my health every single day.
But there's no way to ask my PKM system questions like these: "What was my average TIR last month when I exercised?" , or "Which meals correlate with the biggest post-meal spikes?" — at least not without manually stitching data together.
Next, I plan to integrate a diabetes model into my Neo4j knowledge graph, along with corresponding queries, services, scripts, agents, shortcuts, and voice questions.
Also, I'm currently extending my Calendar model with features for all time horizon clusters: Week, Month, Quarter, and Year, including Health, Diabetes, and Analysis notes for my periodic reviews.
For example, my Week Diabetes, Month Diabetes, Quarter Diabetes, and Year Diabetes notes will offer me further perspectives and insights on my status, progress, and improvement over time.
Scrolling vs Queries
The difference between scrolling and querying is the difference between hunting and asking. When you scroll, you're limited by what you happen to notice. When you query, you get precise answers to precise questions.
To get from scrolling to querying, you need a data model. And that's where the knowledge graph comes in.
What's a Knowledge Graph?
Most data lives in one of two forms: unstructured documents (text you read) or structured tables (rows and columns you query). Both are useful, but neither is great at capturing relationships — how things connect to each other.
A knowledge graph stores information as nodes (things) and relationships (how things connect to each other). Instead of rows in a spreadsheet or text in a document, you get a web of interconnected objects.
A knowledge graph is a knowledge map, or "web of knowledge" rather than a database. It provides the structure, organization, metadata, context, memory, and tools that support my personal knowledge system and my life.
Nodes
For diabetes, a node might be a day, a meal, a glucose reading, or an insulin dose. A relationship connects them: this meal preceded that glucose spike; this insulin dose followed that reading; this day belongs to this week.
Think of it like the difference between a filing cabinet and a mind map. A filing cabinet stores things by location; a mind map stores things by relationship. When you want to understand how things connect — not just where they're stored — a graph is the right tool.
Relationships
A link between two Obsidian notes simply says these are related — but the context and meaning lives in the surrounding text (or optional alias), not in the connection itself. Sometimes it becomes necessary to use intermediate notes to express relationship metadata or content regarding two or more notes (similar to the way join tables are used to represent relationships in a "SQL relational database").
A knowledge graph offers much richer model that makes the relationship explicit and typed. It's not just some related association or connection, but PRECEDED_BY, CAUSED, CORRECTED_BY. The relationship carries meaning independent of the notes it connects, and they can also contain properties just like nodes.
Properties
Nodes and relationships can also carry properties — named values that describe them. Properties are what make nodes queryable and comparable, not just connected.
Since there are usually multiple meals each day, a graph model might have a Day node (DayNote) with date property, and a Meal node (Meal) with properties for title and carbs. The Day would be connected each Meal with a HAS_MEAL relationship with a time property.
Knowledge Graph vs. Context Graph
You'll see these terms used interchangeably in AI discussions, but they're subtly different — and both are relevant here.
A knowledge graph is a domain model: a structured representation of what you know about a subject. Neo4j, Wikidata, and Google's Knowledge Graph are examples. The focus is on modeling entities and their relationships accurately and completely.
A context graph (sometimes called a memory graph) is a more recent framing that's emerged alongside AI agents. It's specifically about giving an AI model the relevant state it needs to reason well right now — what's happening today, what patterns have emerged recently, what's most pertinent to this conversation. The focus is on retrieval and relevance for AI reasoning, not on completeness of the domain model.
A useful analogy: a knowledge graph is a well-organized library. A context graph is the well-briefed assistant who already knows your research question and has the right books waiting on the desk when you arrive.
In practice, the line blurs. My system uses Neo4j as both: it's a domain model of my diabetes and daily life and it's the memory layer that delivers structured context to AI conversations. The graph serves both purposes because the same relationships that make data queryable also make it retrievable for AI reasoning.
Thinking in Objects
Before you can query a graph, you have to think in objects. This is a shift from how most notes are structured.
A traditional daily note is a document — a linear sequence of information written for a human reader. A graph object is a node with properties and relationships — structured data designed to be traversed by a machine.
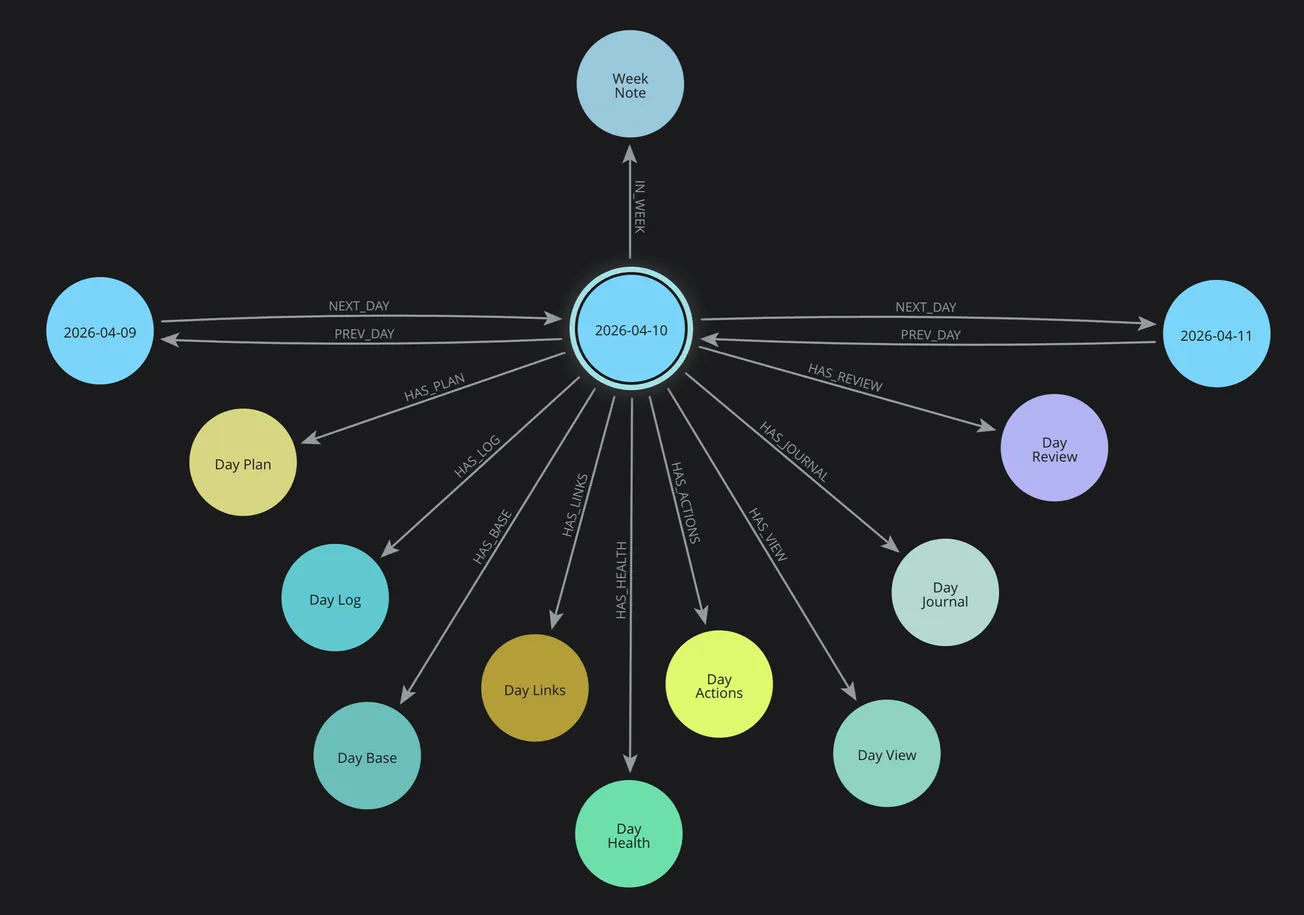
In my PKM system, each day is an object. Each day has cluster objects attached to it: Plan, Log, Journal, Health, Diabetes, Review, Actions. Each cluster has properties. Each day connects to its neighbors (previous/next) and to its containing time horizons (Week, Month, Quarter, Year).
This isn't just organization — it's addressability. Every piece of information has a precise location in the graph that can be reached by traversing relationships.
The power isn't in any single node — it's in being able to traverse the connections. You can start at today's breakfast and follow the graph to the glucose reading 90 minutes later, then to the correction dose, then to the bedtime reading. The relationships are first-class data, not just implied by proximity in a document.
My Diabetes Graph
At this point in the evolution of my PKM system, my diabetes graph is primarily realized in the Obsidian notes for Day Diabetes and Day Analysis that are automatically produced every morning during my Morning Review.
My existing Neo4j Graph Services and Cypher Query Library primarily focus on existing Calendar, Health, and Review services associated with my Day Clusters in my Obsidian notes.
Day Clusters
Initially, I established my knowledge graph to focus on my Day clusters in the Calendar space in my Obsidian notes for time-based knowledge. I also established the time horizon structure (week, month, quarter, year), temporal relationships (prev/next) for all cluster notes, and wayfinder generation for navigation throughout my notes by time and type.
PKM Services
Then, I implemented my PKM services for Calendar, Health, and Review services for my Day Startup and Morning Review workflows. I have refined my Plan, Log, Health, Journal, Review, and Analysis cluster notes based on actual usage and experience with daily practice.
Day Diabetes and Analysis
Currently, my Day Diabetes and Day Analysis notes are foundations for my diabetes management (Log, Health, Diabetes) and workflow practices (Plan, Log, Review, Links, Actions).
Also, my visual tools help me with visual thinking, brainstorming, planning, and tracking activities (and offer screenshots for my notes and website posts).
Diabetes Query
Right now, my knowledge graph model does NOT have a Diabetes node and HAS_DIABETES relationship in my Neo4j Day Cluster structure, like I have for Plan, Log, Health, Review, Links, Actions, Base, and View.
Therefore, today I can't use a Cypher query like this to return all Diabetes nodes that have a relationship HAS_DIABETES with a Day.
MATCH (day)-[:HAS_DIABETES]->(diabetes)
RETURN diabetes
This query does NOT return any matching Neo4j nodes in my current Neo4j knowledge graph; it returns an error "Relationship type does not exist".
That's because so far I have only generated my Day Diabetes note for each Day cluster in my Obsidian vault. I have not yet integrated the Diabetes node and relationship to a Day in my Neo4j graph model.
Work in Progress
This illustrates that my system is a work in progress that evolves every day because I'm building it while using it. My PKM system improves incrementally from my actual experience and requirements. This shows exactly where the system stands today and where it's heading.
However, now I'm extending my Efforts by making Plans and defining Actions to be completed to extend my graph model, sync my Diabetes data between Neo4j graph and Obsidian notes, and enable additional query capabilities that are not available with simple Obsidian Bases or Dataview queries.
Model
My Day Cluster data is modeled as a set of interconnected objects including Plan, Log, Health, Diabetes, Analysis, Review, and Actions:
- DayNote — the root hub node for each day, with date properties and links to all clusters
- Day Plan — my daily intentions with focus effort, key actions, events, and sessions
- DayLog — timestamped activities and events
- DayHealth — meals, carbs, exercise, energy, mood
- DayDiabetes — glucose statistics, TIR (tight and standard), period analysis, hourly breakdown
- Day Analysis — summary, insights, plus, minus, next (overall and categories: health, work, learning), energy analysis
- Day Review — review today, preview tomorrow
Services
When I create a day via my Calendar services, Neo4j creates all of these nodes and connects them with typed relationships: HAS_HEALTH, HAS_LOG, HAS_PLAN, PREV_DAY, NEXT_DAY, IN_WEEK, IN_MONTH. The HAS_DIABETES relationship is planned as the next extension.
The Dexcom API feeds glucose data directly into the Diabetes note. Glooko PDF parsing adds insulin data. Calendar events from macOS populate the Schedule note. The graph reflects the full picture of each day, not just the text I happened to write.
Real Queries
My current Neo4j Graph Services has a Query Library with named queries that support my PKM Calendar, Health, Review, and Note services, including providing context data for my Template services for generating Obsidian notes.
Get Count of All Node Types
Here's a sample PKM named query (Count nodes by type) that uses a Python function (node_count_by_type()) to execute the following Neo4j Cypher query.
It matches all nodes (n) in the Neo4j graph and returns their primary label (node type), such as DayNote and a count of the instances of that type, and then it orders the output by descending count and then nodeType.
It's similar to an Obsidian Dataview or SQL query, but much more powerful and extensible.
MATCH (n)
RETURN
	labels(n)[0] AS nodeType,
	count(n) AS count
ORDER BY count DESC, nodeType
Query results are available visually in the Neo4j Desktop Query or Explorer views for interactive use. Also, CSV or JSON responses can be processed by my PKM services using Python and generate Obsidian notes like the following cluster summary.
Cluster Summary
Here's a simple Markdown table with a summary of Neo4j nodes in with counts from highest to lowest, which reflects there were 135 Day clusters when this post was written.
| Cluster | Node Type | Count |
|---|---|---|
| Day | DayActions | 135 |
| Day | DayBase | 135 |
| Day | DayHealth | 135 |
| Day | DayJournal | 135 |
| Day | DayLinks | 135 |
| Day | DayLog | 135 |
| Day | DayNote | 135 |
| Day | DayPlan | 135 |
| Day | DayReview | 135 |
| Day | DayView | 135 |
| Week | WeekNote | 22 |
| Month | MonthNote | 6 |
| Quarter | QuarterNote | 4 |
| Year | YearNote | 2 |
Query Library
I have a library of pre-built Cypher queries for common PKM operations in my system. Most of these return a Python Lists and/or Dictionaries as a JSON arrays and/or objects for processing my PKM services, scripts, agents, apps, and shortcuts.
This is a list of my current named graph queries.
Dashboard
- Get complete context for today
- Get today with minimal navigation
- Compare yesterday and today
- Get all active work across horizons
- Get current week overview
Planning
- Get planning cascade from day to year
- Get actions rollup from all horizons
Temporal analysis
- Get last N days
- Get days in date range
Maintenance
- Count nodes by type
- Find orphaned cluster notes
- Find broken navigation chains
Specific date queries
- Get specific day by date
PKM Services
My PKM system runs on Python services covering Neo4j Graph, Obsidian note generation, Calendar, Health, and Review — each with dedicated functions that work together through the FastAPI server.
PKM Scripts
Python scripts provide a convenient way to use PKM services from commands, agents, Swift apps, Shortcuts, or Siri.
These are current scripts and commands organized by PKM Service with a brief description. Each include additional options and flags to allow customization, but they have been omitted for brevity.
PKM Service
My PKM System uses a Python FastAPI server that provides my PKM Services. I have a script that's used to automatically start the PKM service, as well as additional administrative commands.
| Script | Command | Description |
|---|---|---|
| pkm-service | start | Start the PKM service in the background |
| stop | Stop the PKM service | |
| restart | Restart the PKM service | |
| status | Check if service is running | |
| logs | View recent logs |
Calendar Scripts
Every morning at 7 am, a Day Startup agent automatically creates and syncs a Day cluster for today (and any new time horizon clusters such as week, month, quarter, or year) in my Obsidian notes and Neo4j knowledge graph.
This orchestrates the following steps in my Morning Review workflow so can begin my day.
- Creation of all Obsidian Day Cluster core and support notes as well as visual tools.
- Generates a Day Schedule for my Day Plan with events and sessions from my Calendar
- Creates Neo4j day cluster nodes, relationships, and properties, including sync with bi-directional IDs, as well as time horizons (week, month, quarter, year), temporal connections (prev/next), and navigation wayfinder links.
- Opens Day Workspace for my Day cluster in Obsidian
- Commit Git with all Obsidian changes since yesterday.
| Command | Description |
|---|---|
| pkm-day create | Create day cluster with Neo4j sync |
| pkm-week create | Create week cluster |
| pkm-month create | Create month cluster |
| pkm-quarter create | Create quarter cluster |
| pkm-year create | Create year cluster |
| pkm-calendar refresh | Refresh Day Schedule |
Health Scripts
My Health Script automatically downloads, integrates, analyzes, and summarizes diabetes data from Dexcom (glucose) and Glooko (insulin) websites, and generates a Day Diabetes note in Obsidian for my Morning Review.
| Command | Description |
|---|---|
| pkm-health sync-full | Generate Day Diabetes review |
Review Scripts
My review scripts uses Claude AI to generate Day Analysis for my Day Review from the Plan, Log, and Health notes in my Day Cluster.
This provides a Summary, Insights, and Energy Analysis across my Day comparing my Plan intentions with actual Log activities; it uses Plus-Minus-Next methodology both overall and by categories of Health, Learning, and Work.
| Command | Description |
|---|---|
| pkm-review generate | Generate Day Analysis with Claude AI for Day Review |
Future Query Examples
These Cypher queries illustrates what's possible when I extend my knowledge graph with my diabetes data to enable this capability.
30-day TIR trend:
This show my glucose time in range over the past 30 days.
MATCH (d:DayNote)-[:HAS_DIABETES]->(diab)
WHERE d.date >= date() - duration('P30D')
RETURN d.date, diab.tir_standard
ORDER BY d.date
Meals with highest post-meal spike:
This query illustrates how I can find which meals produce the highest post-meal glucose spikes.
MATCH (d:DayNote)-[:HAS_HEALTH]->(h)
WHERE h.breakfast_carbs IS NOT NULL
RETURN
	d.date, h.breakfast_meal, h.breakfast_carbs, h.glucose_after_breakfast
ORDER BY h.glucose_after_breakfast DESC
LIMIT 10
Exercise impact on next-day TIR:
This one shows how I can determine how exercise impacts my next-day glucose time-in-range (TIR).
MATCH
	(d:DayNote)-[:HAS_HEALTH]->(h),
	(d)-[:NEXT_DAY]->(next)-[:HAS_DIABETES]->(nextDiab)
WHERE h.exercise_completed = true
RETURN d.date, nextDiab.tir_standard
ORDER BY d.date
These queries are forward-looking — I haven't yet integrated diabetes data into my Neo4j graph model. But the data already exists in my Day Diabetes notes every day. Adding the graph model will simply make it queryable.
Why This Matters
The real goal isn't a fancy database. The goal is to give an AI model structured, queryable context so it can be a genuine analytical partner rather than a conversational chatbot.
With a knowledge graph as the foundation, I can provide a Claude prompt with not just today's glucose data — but last month's patterns, the meals that tend to spike me, the exercise habits that improve my TIR, and the Cypher queries that surface anomalies. The AI conversation becomes informed by persistent, structured memory rather than a blank slate.
This is the difference between asking a doctor who's seeing you for the first time and asking one who's followed your case for years. Context transforms the quality of the answer.
Getting Started
You don't need a production Neo4j setup to benefit from graph thinking. Start smaller:
- Model your data as objects. What are the "things" in your diabetes management? Days, meals, readings, insulin doses, exercise sessions. What properties does each have?
- Identify the relationships. What connects these objects? A meal precedes a glucose reading. An exercise session affects the next day's TIR.
- Try Neo4j Desktop. It's free for local use, runs on your Mac, and has a visual browser so you can see your graph come to life.
- Start with one query you care about. What's the one pattern you've always wondered about but never been able to verify? Build toward answering that.
The knowledge graph isn't the end of the journey — it's the foundation that makes everything else possible.
What's Next
- 🔧 Part 5: Build Your Own — How to start building your own AI health system, regardless of technical background. This puts it all together with AI-powered analysis and the PKM services that tie the graph to your daily workflow.
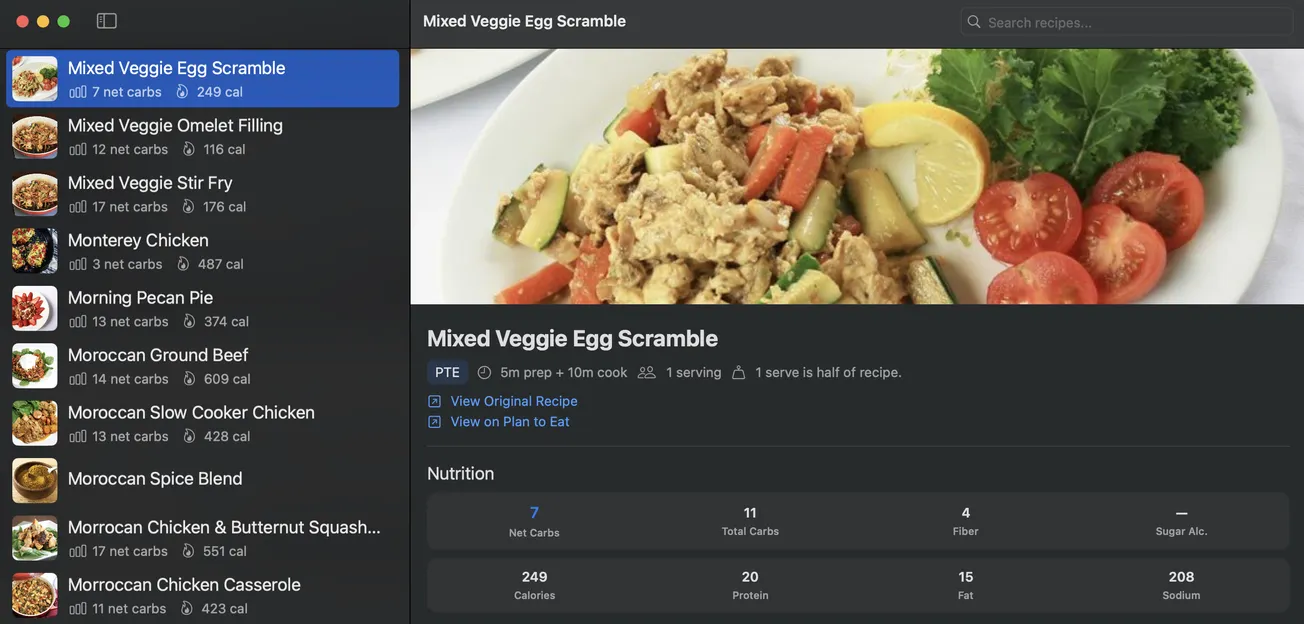
- 🍴 Part 6: Teaching Your AI Coach to Cook — How food choices connect directly to glucose outcomes — building a recipe intelligence system that learns from your actual responses.
Start from the beginning: 🚀 Part 1: The Transformation
The Day Cluster PKM structure that organizes all this data is covered in a separate series: [📅 Day Cluster Part 1](https://blog.warrenweb.net/day-cluster).
Suggested References
If you want to explore further, you might check out these resources for more information.
- Neo4j — neo4j.com — Graph database; their "Graph Academy" has good free courses
- Anthropic's documentation on tool use and memory — How agents use structured context
- GraphRAG (Microsoft Research) — Context graphs in AI retrieval
- Connected: The Surprising Power of Our Social Networks (Christakis & Fowler) — Readable introduction to graph thinking for non-developers (not technical)
- Nick Milo's Linking Your Thinking (LYT) framework — Foundation that my custom PKM system builds on.
