The AI Diabetes Coach series:
・Part 1: The Transformation
・Part 2: System Architecture
・Part 3: AI Prompt Engineering
・Part 4: Knowledge Graph
・Part 5: Build Your Own
➔ Part 6: 🍴Teaching Your AI Coach to Cook
My AI diabetes coach could tell me that Wednesday evening's glucose spiked to 204 mg/dL. It could identify the time, the rate of rise, and how many insulin correction units it took to bring things back down. What it couldn't tell me was why — because I hadn't told it what I ate.
That's the missing link in any glucose management system. The continuous glucose monitor (CGM) captures what happened (every 5 minutes). The automated insulin pump records what I did about it. But the meal — the actual cause — lives in my head, a napkin note, or a vague Dexcom entry labeled "Dinner" with a question mark. In my case, a slice of banana bread around 9 PM turned a stable 100 mg/dL into a 200+ mg/dL overnight event. The system saw the spike. It just didn't know about the banana bread snack.
Closing that loop required building something I didn't have: a structured recipe and meal database that connects what I eat to what my glucose does. Over the past few weeks I've built exactly that — starting with 3,321 recipes from my two primary sources, Plan To Eat and Diabetes Meal Plans, and building a macOS app to browse, filter, and surface the nutrition data I actually need at mealtime. Net carbs front and center. Glycemic impact visible before I pick up a fork.
This is Part 6 of the AI Diabetes Coach series. It's about teaching the system to cook.
The Missing Link
My AI diabetes coach knew my glucose patterns from the Day Diabetes note that I automatically create for my PKM Morning routine to review my diabetes for the previous day. However, it does not understand what caused those glucose outcomes and connect those results to my meals, snacks, recipes, restaurants, and food choices.
My PKM Health services create a Day Diabetes note in Obsidian that shows glucose summary statistics.
- Daily summary: average, time in range, range (min-max) for the whole day
- Period analysis: summaries for night, morning, afternoon, and evening
- Hourly breakdown: event log timeline for each period.
It includes an Alert Analysis with summary and details about alerts and calibrations, such as Low or High Glucose, Signal Loss, etc.
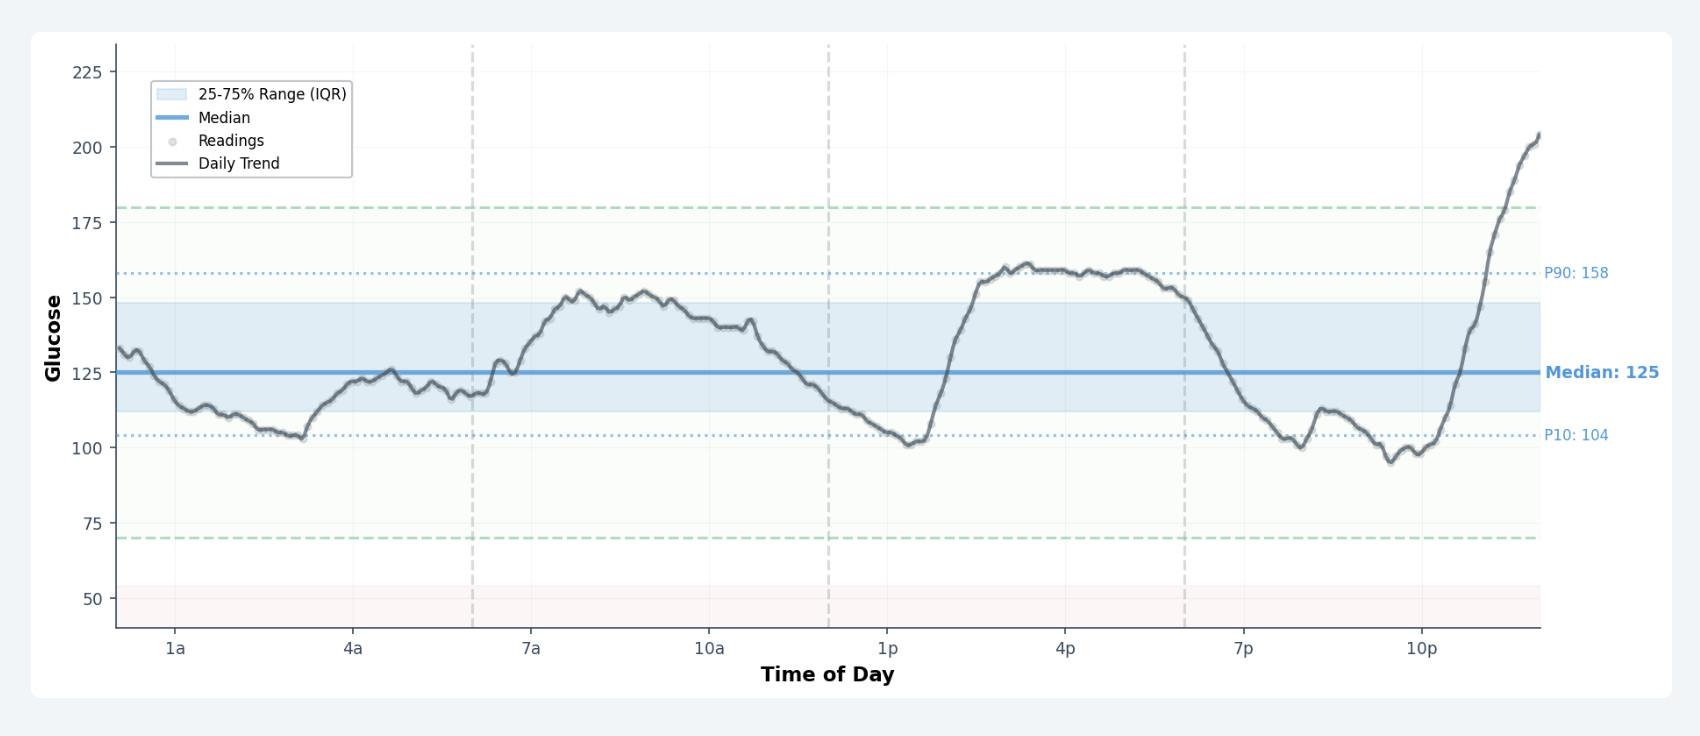
This chart shows my Glucose across all daytime periods (night, morning, afternoon, evening). It also illustrates basic summary statistics with the light green area for my target time-in-range (70-180) and a marker for the daily median (125) at the 50% percentile, as well as the light blue area between the 10% and 90% percentiles. It's pretty obvious that something happened after 10 PM in the evening, whereas the rest of the day was great.
When you spot a period that needs further investigation, It helps to have a a period chart that highlights key summary statistics for each period. For example, it's very clear that the evening was unusual with the high peak glucose value, when everything looked perfect until then.
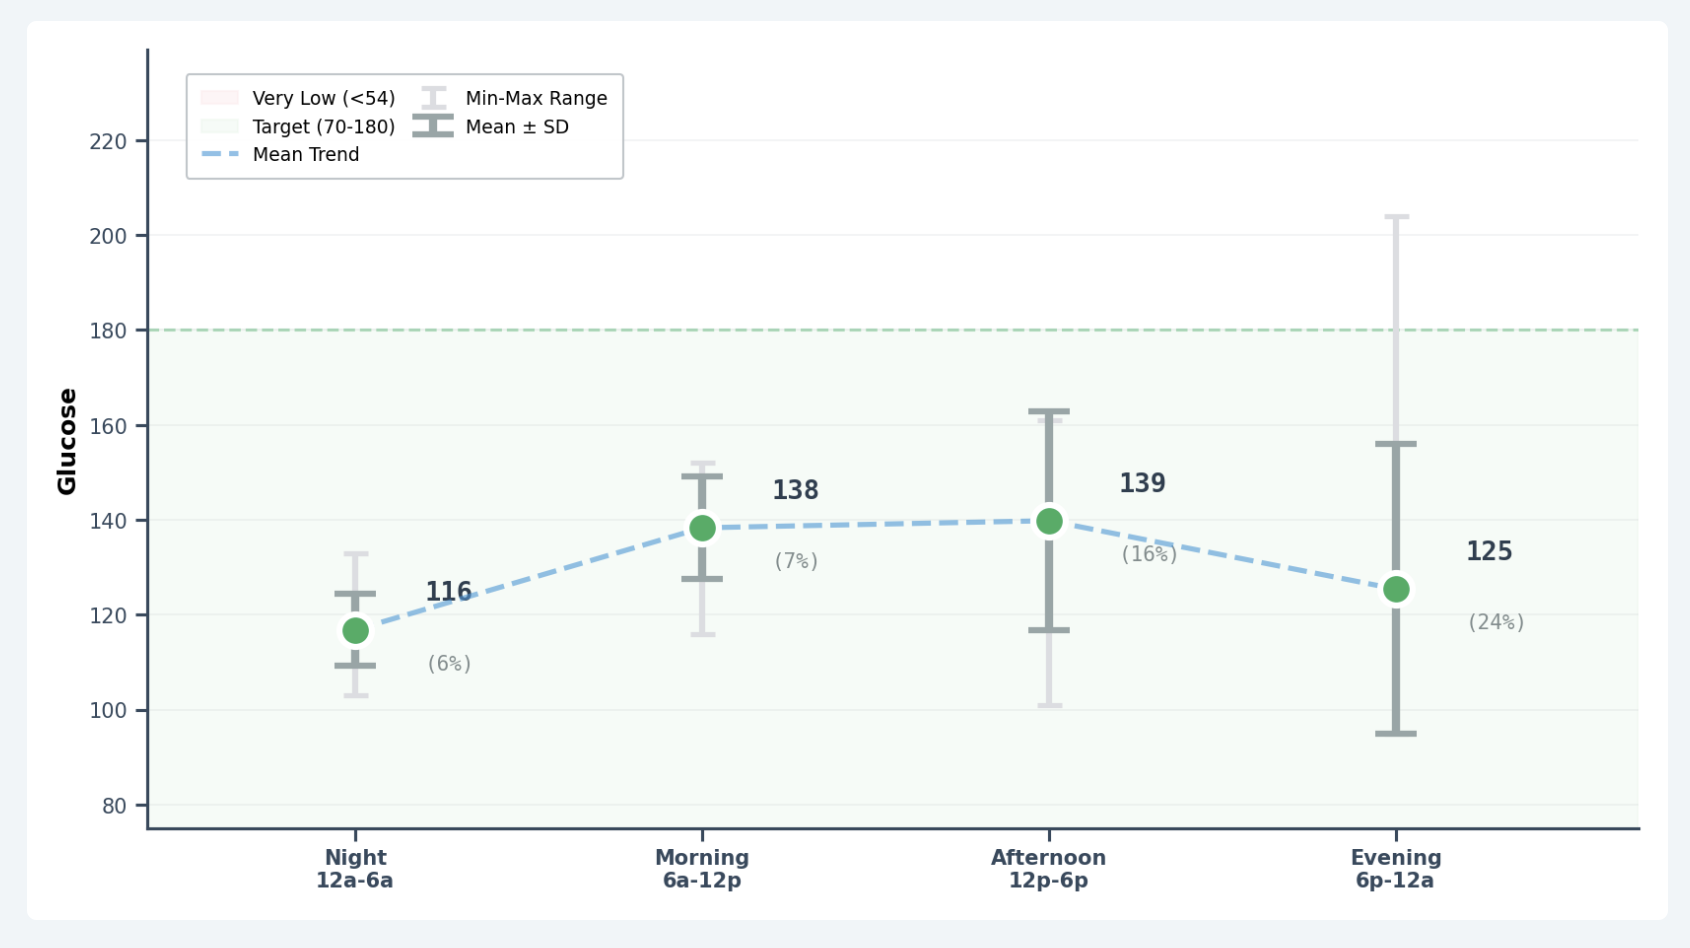
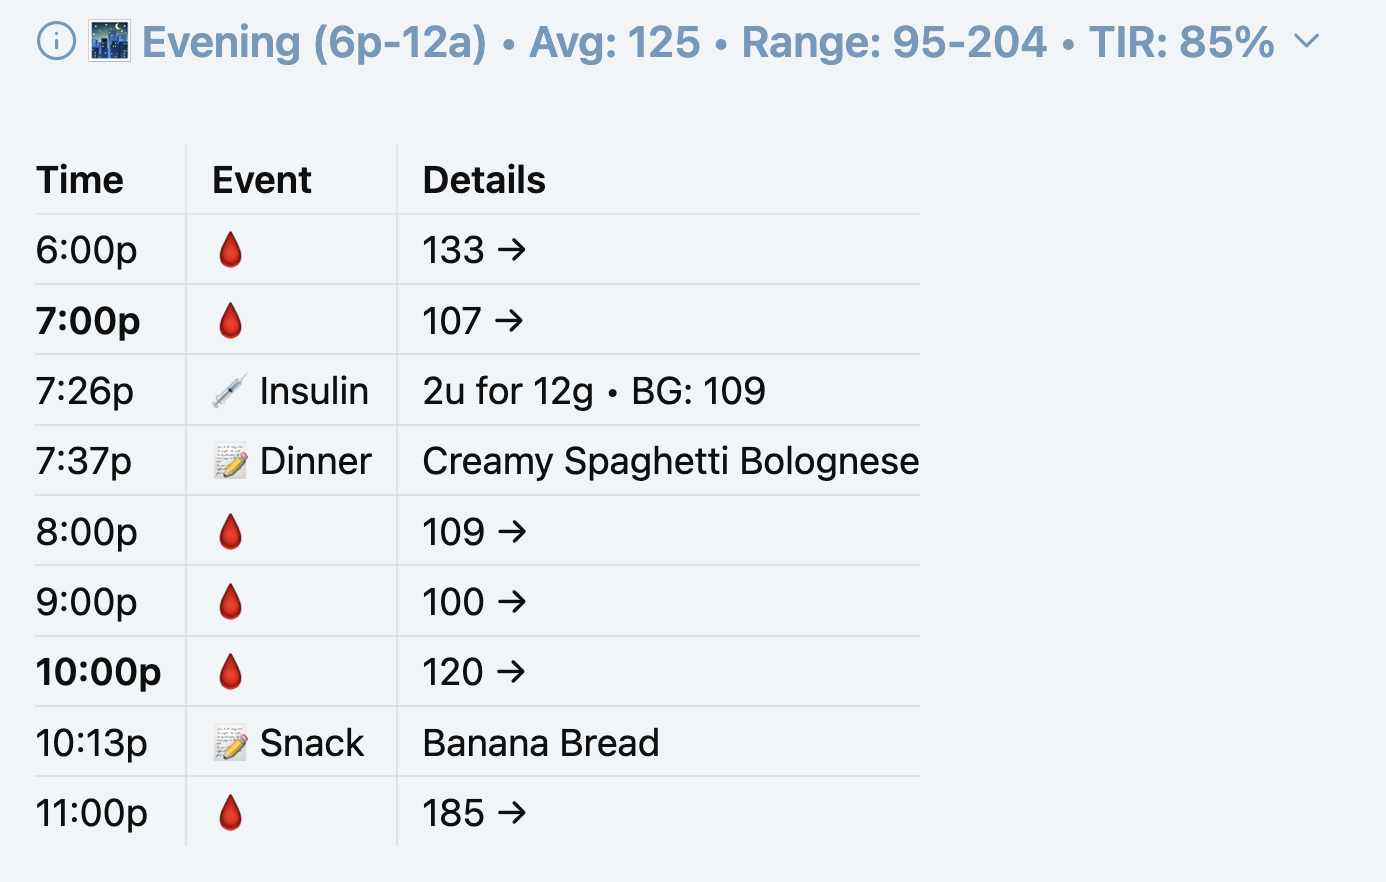
It's also helpful to have a table that summarizes key statistics for each period. This shows that peak (Max) as 204 for the evening, with increasing variability (SD & CV), and range (109), and time in range dropped to only 85%.

My meal logging is manual and inconsistent. Sometimes I have typing (or auto-correction) mistakes such as "Breakfadt Taco". At least I have the opportunity to make corrections in my Day Diabetes note (without rerunning my Health Sync automated workflow) that will recreate the Day Diabetes note.
The data was there — glucose from Dexcom, insulin from Glooko, manual meal entries from my iPhone — but scattered across systems with no common thread. What I needed was the meal data structured well enough to connect cause and effect.
There is adequate information included in my Day Diabetes note with the statistics, graphs, tables, and timelines that I can use by scanning its content as I do my Day Review for my health (including diabetes). But that requires more time, and there are patterns and connections that I miss doing this manually.
I thought there was a better way to automatically perform this analysis using Claude AI every day. I could integrate my meals, recipes, and nutrition for enhanced diabetes intelligence if I provided my Day Diabetes note with my structured diabetes data.
Building the Recipe Database
The recipe data existed — it was just scattered and disconnected.
Recipes & Meal Plans
I have two primary sources for my recipes and meal plans.
- Diabetes Meal Plans (DMP) is a curated library of healthy diabetes-friendly recipes, each with carefully calculated nutrition data. Every Thursday a new weekly meal plan arrives with lunch and dinner suggestions selected for low-carb glycemic control.
- Plan To Eat (PTE) is my primary recipe database — a personal collection of recipes gathered from DMP, food blogs, cookbooks, and family favorites, organized into weekly meal plans with an auto-generated shopping list with all the ingredients needed from the grocery store.
Neither system was designed to talk to my glucose monitor. A recipe in PTE knows the net carbs for its ingredients. My CGM records my glucose values every 5 minutes and occasional alerts or calibrations throughout each day. And my insulin pump captures my insulin doses for meals and corrections. Nothing connected them.
The problem: these two systems didn't talk to each other, and neither talked to my glucose data. I knew a recipe had 12g net carbs. I didn't know whether 12g of bolognese behaved the same as 12g of banana bread. Spoiler: it doesn't.
The first step was building a local cache from both libraries — 1,215 DMP recipes and 2,192 PTE recipes stored as structured JSON documents, deduplicated across both sources into roughly 3,200 unique recipes. When the same recipe appears in both DMP and PTE, the PTE version takes precedence since it reflects any personal modifications I've made. I needed a structured recipe and meal database so I could connect what I eat to what my glucose does.
I developed PKM Recipe services and scripts for both DMP and PTE websites that sync cached JSON recipes with a local SwiftData SQL database for all the recipes, meals, and nutrition information that can then be integrated with my Day Diabetes structured diabetes data, Neo4j knowledge graph, and Day cluster Obsidian notes.
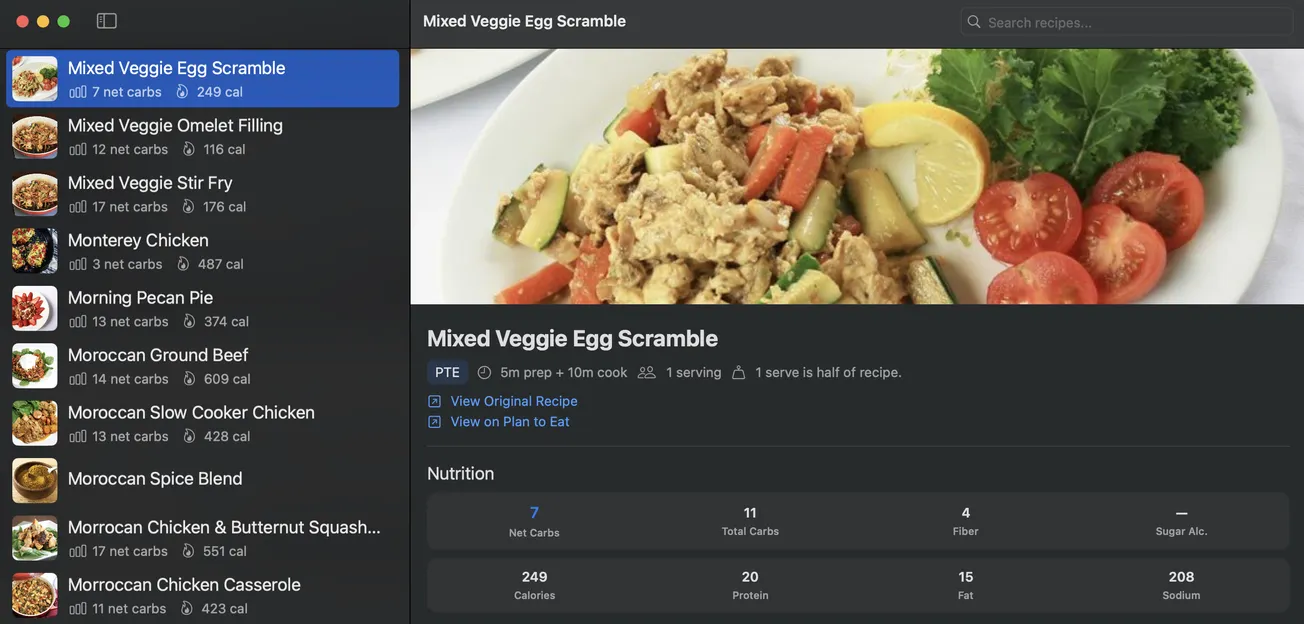
PKM Recipes App
From that cache, I built PKM Recipes — a native Swift app as user interface on either macOS and iOS for my PKM Services that use Python, Neo4j, Obsidian, and Claude AI. It will allow me to browse, filter, and search my recipes with nutrition data front and center.
Net carbs are highlighted in every recipe row and prominently displayed in the detail view alongside total carbs, fiber, protein, fat, and sodium. The goal was simple: make the carb count visible at the point of decision needed for mealtime before the meal is plated.
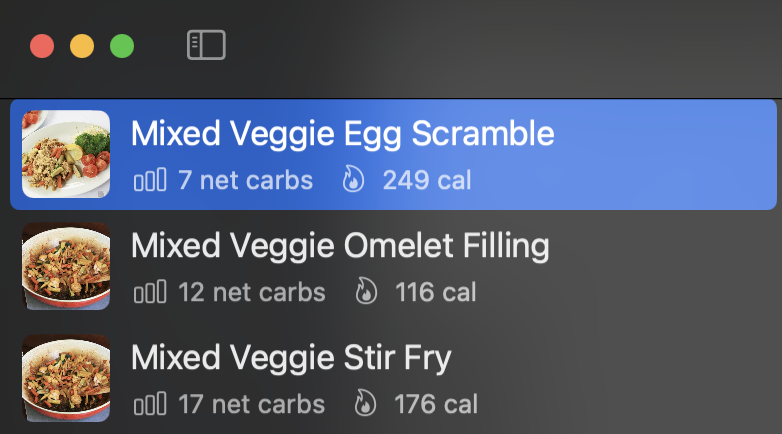
I started with a simple interface with a Recipe List in the sidebar and a Recipe Detail for a selected recipe. For example, this shows a Mixed Veggie Egg Scramble. As I use the app every day, I will continually make improvements based my on my actual usage and workflow requirements.
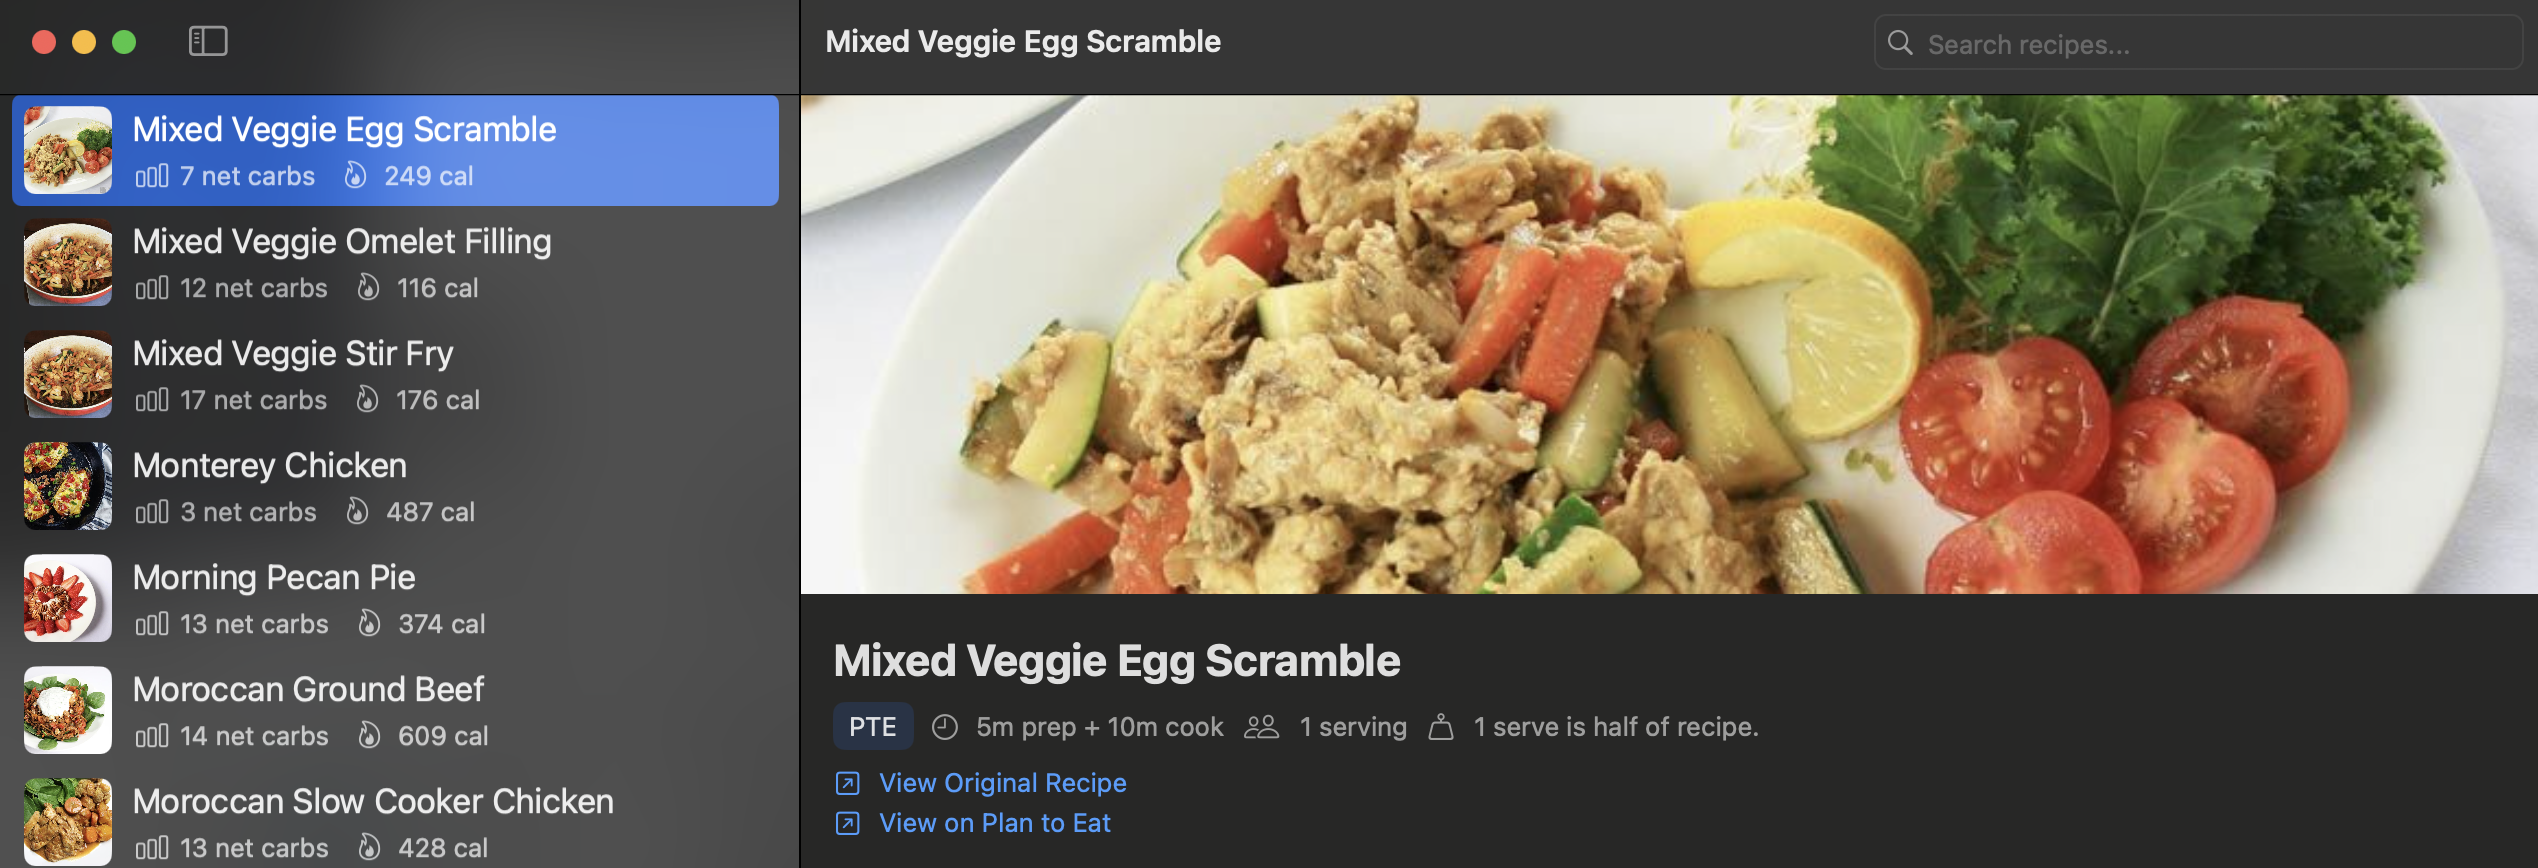
Searching for "mixed veggie" returns all matching recipes. Filtering to DMP shows only the clinically curated recipes.
The nutrition panel shows the two numbers that matter most for dosing: net carbs for the bolus calculation, and total carbs plus fiber to understand the glycemic profile.

The recipe shows the full ingredient list.

Step-by-step cooking instructions are included as well.

See the Recipe List sidebar and complete Recipe Detail view.
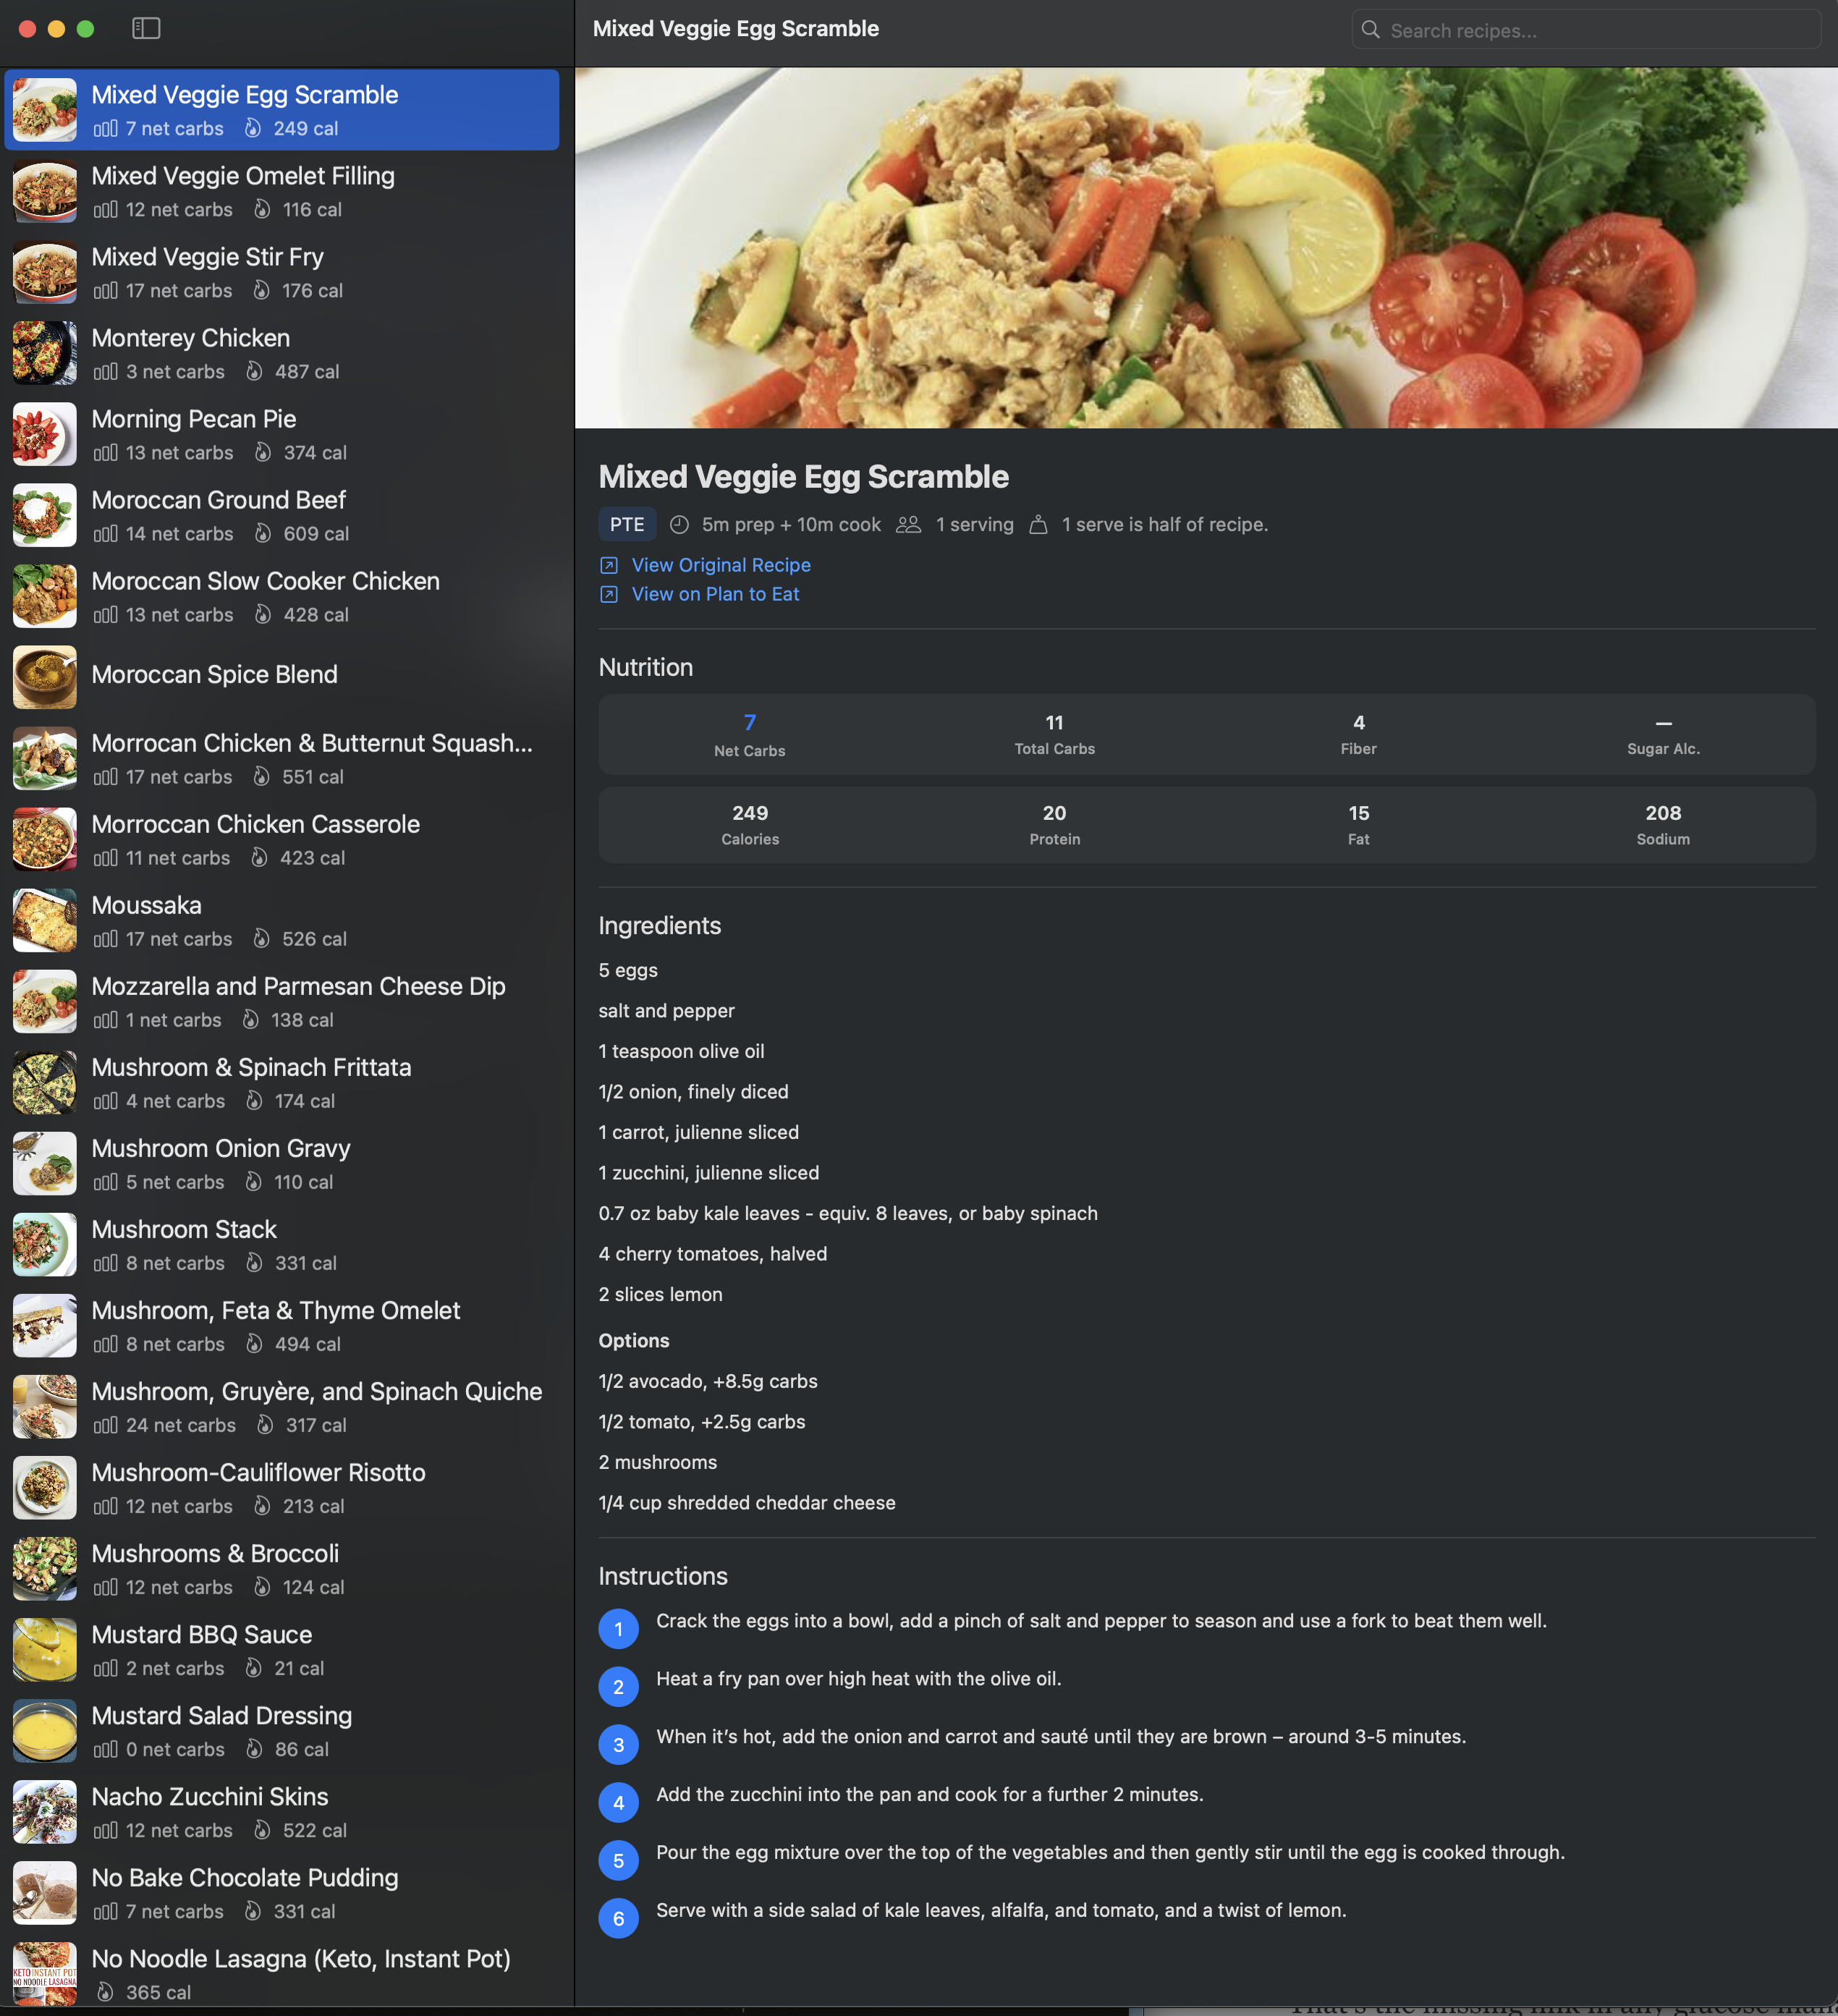
This is the foundation. A searchable, structured, locally-cached recipe database with accurate nutrition data — available offline, integrated into the same system that tracks my glucose.
Closing the Loop
The banana bread incident is the clearest illustration of why meal data matters.
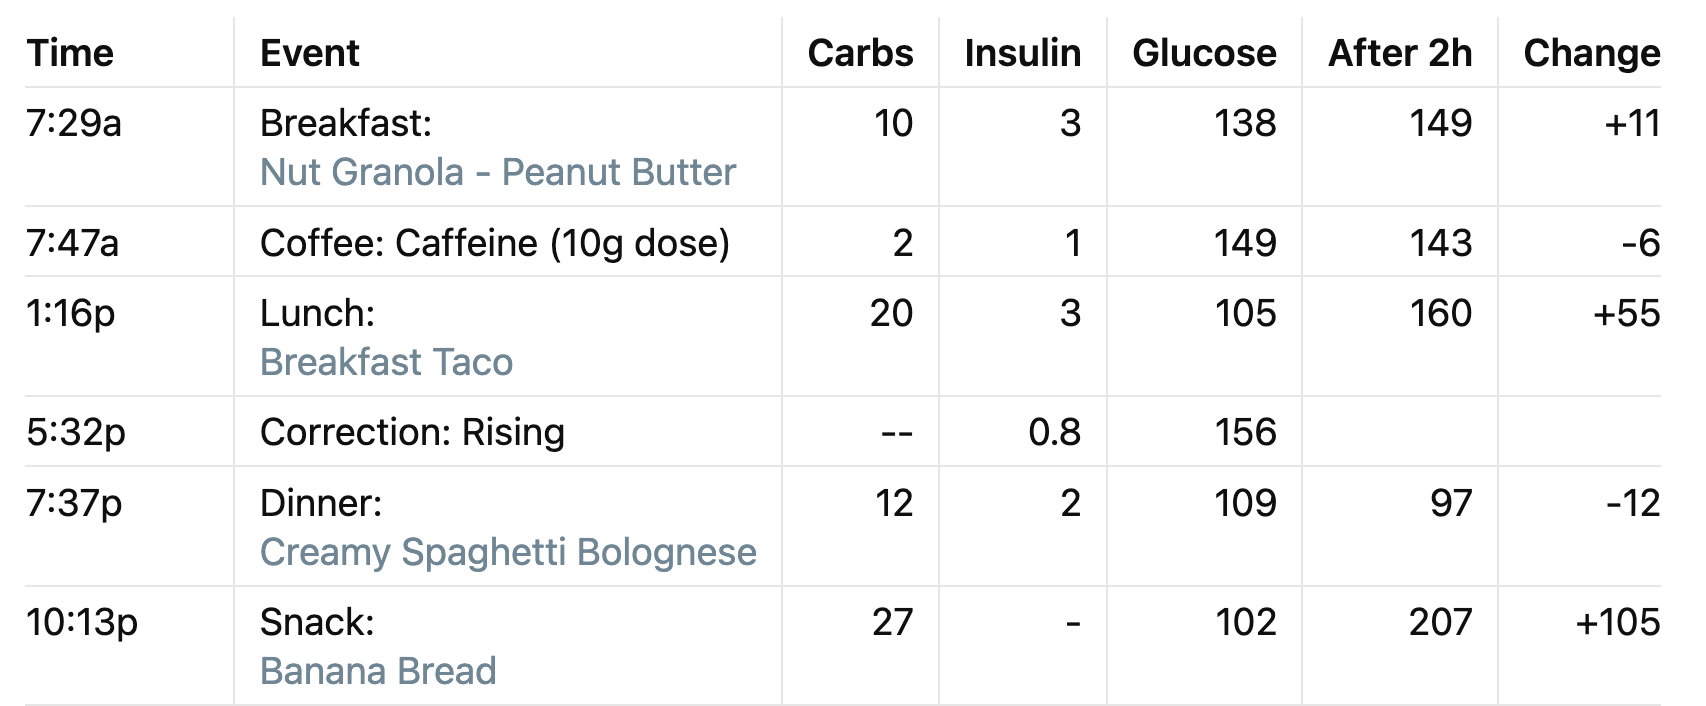
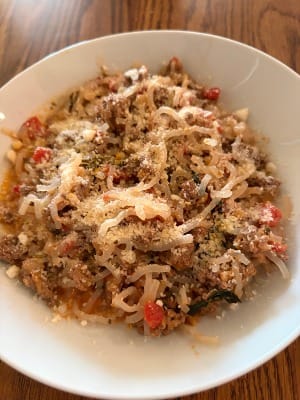
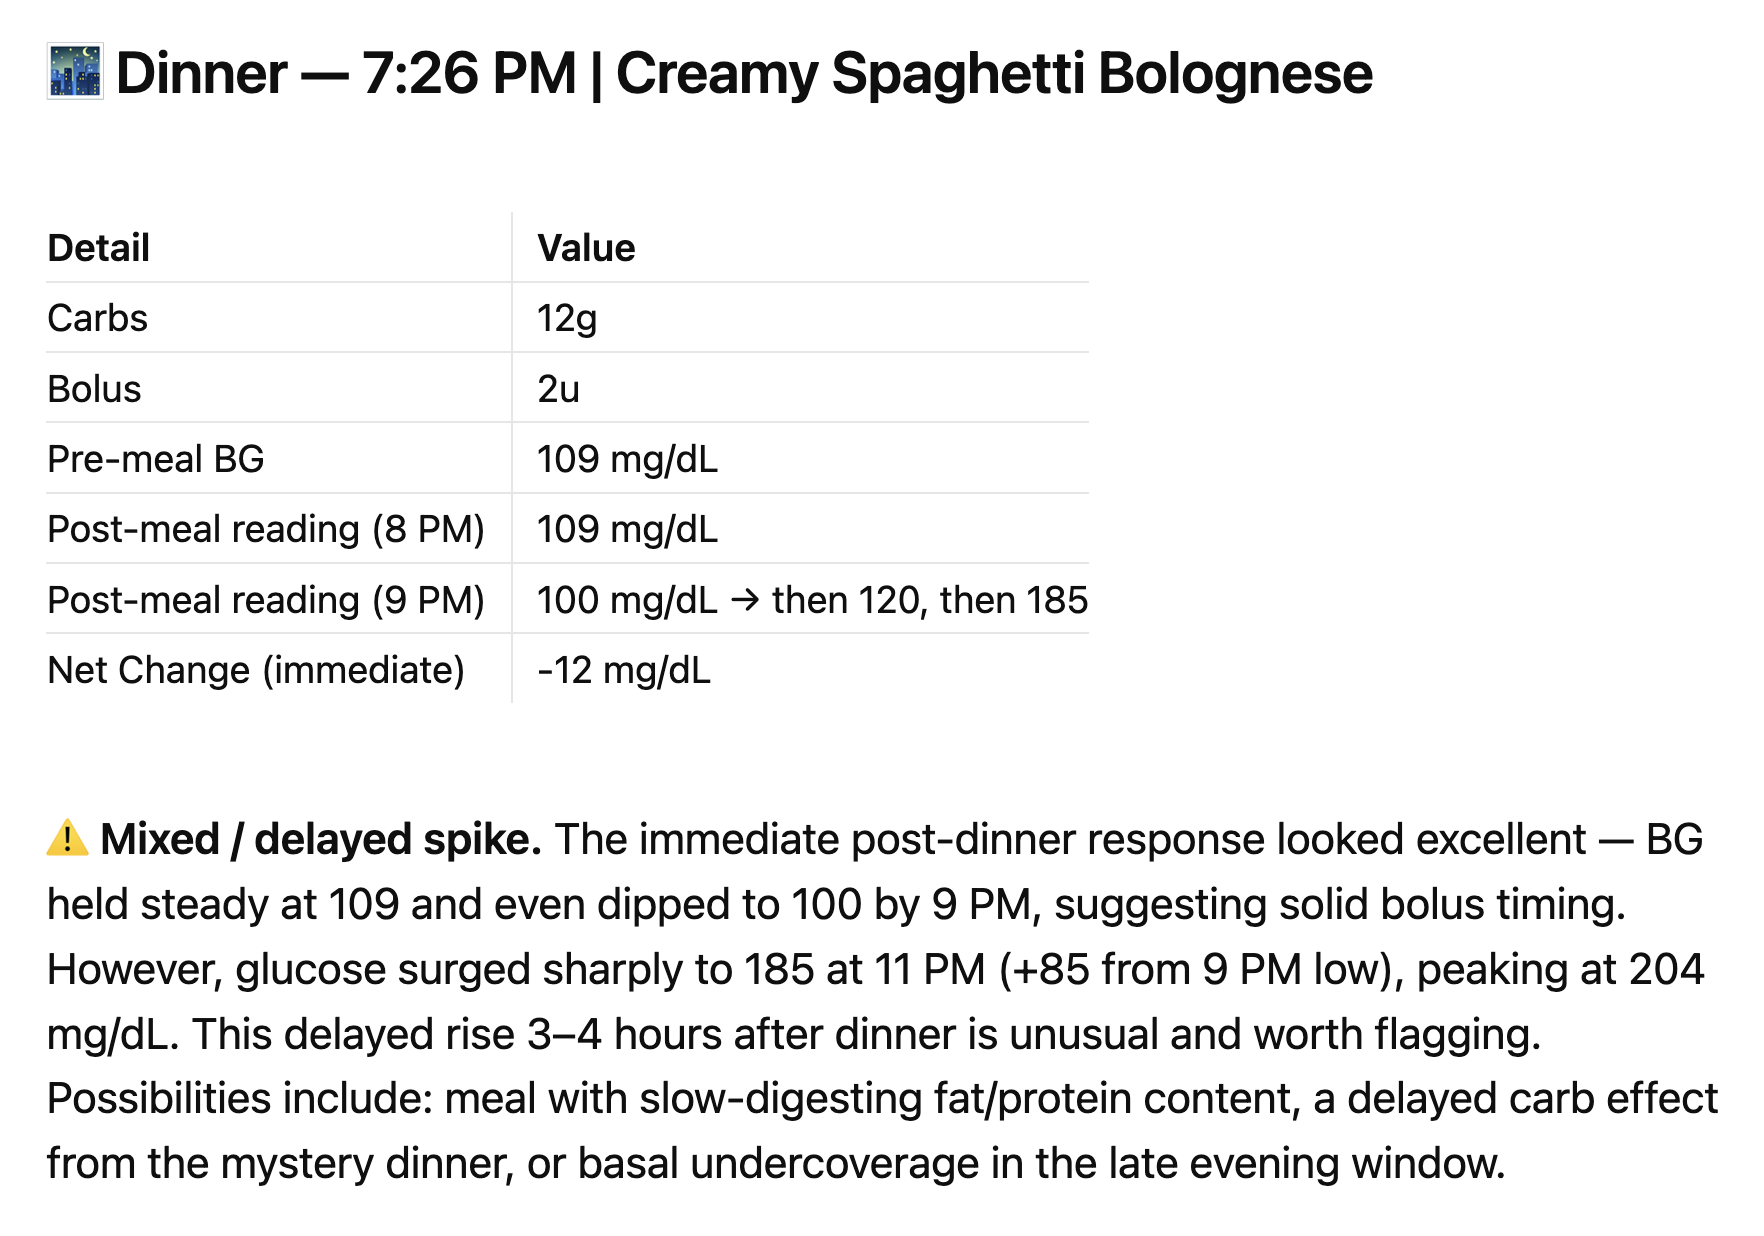
On a recent Wednesday evening, I had Creamy Spaghetti Bolognese (with Miracle Noodles) for dinner; my glucose was 103 before the meal and only 99 after 2 hours when I checked. Actually, that should have been a comfortable level — exactly where I wanted it. Low enough to feel good, stable enough to coast through the night.
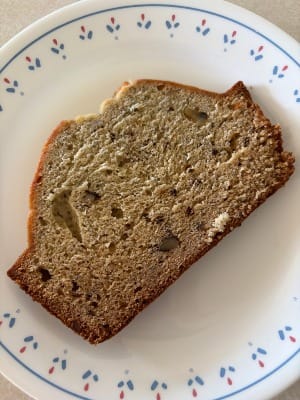
However, for some reason, I thought maybe it might need a small boost to raise my glucose before bed and I reached for a slice of banana bread that my wife had made (without any insulin dose).
It was the wrong call. By 11 PM, glucose had climbed to 185. By midnight it was 204. It kept rising until 1:40 AM when I noticed it was still hovering around 190 and took a correction insulin dose that slowly brought it down through the rest of the night with additional assistance from my insulin pump to reach my 110 target (and my fasting glucose was 103 when I woke up).
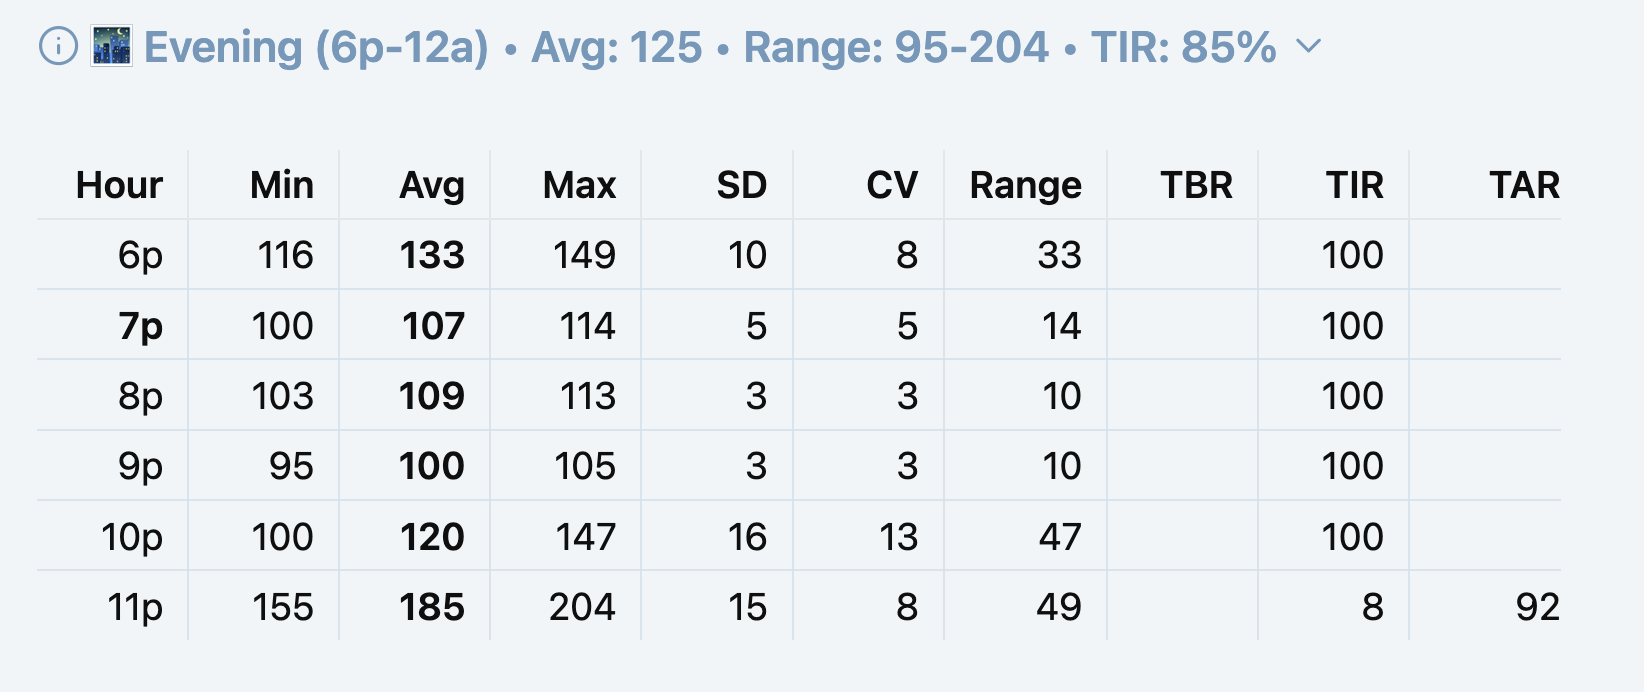
Notice how I was 100% time in range (TIR) throughout the evening until I ate the banana bread at 10:13 PM, and it was only 8% in range over the next hour from 11 PM - midnight with a max glucose of 204.
However, I had initially forgotten to actually manually log that I had Banana Bread as a snack at 10:13 PM, and I hadn't taken an insulin dose, so there was only a steep glucose rise at the end of the day.
The AI coach saw all of this, which was covered in the Day Diabetes Analysis that was generated automatically. It flagged the spike, tracked the corrections, noted the overnight disruption.
What it couldn't do was connect the event to its cause — because banana bread wasn't in the system. There was no entry, no carb count, no glycemic context. Just a mysterious spike that looked, from the data alone, like a basal failure or a delayed dinner absorption.
It highlighted that the day was excellent, except for that unknown spike late in the evening.
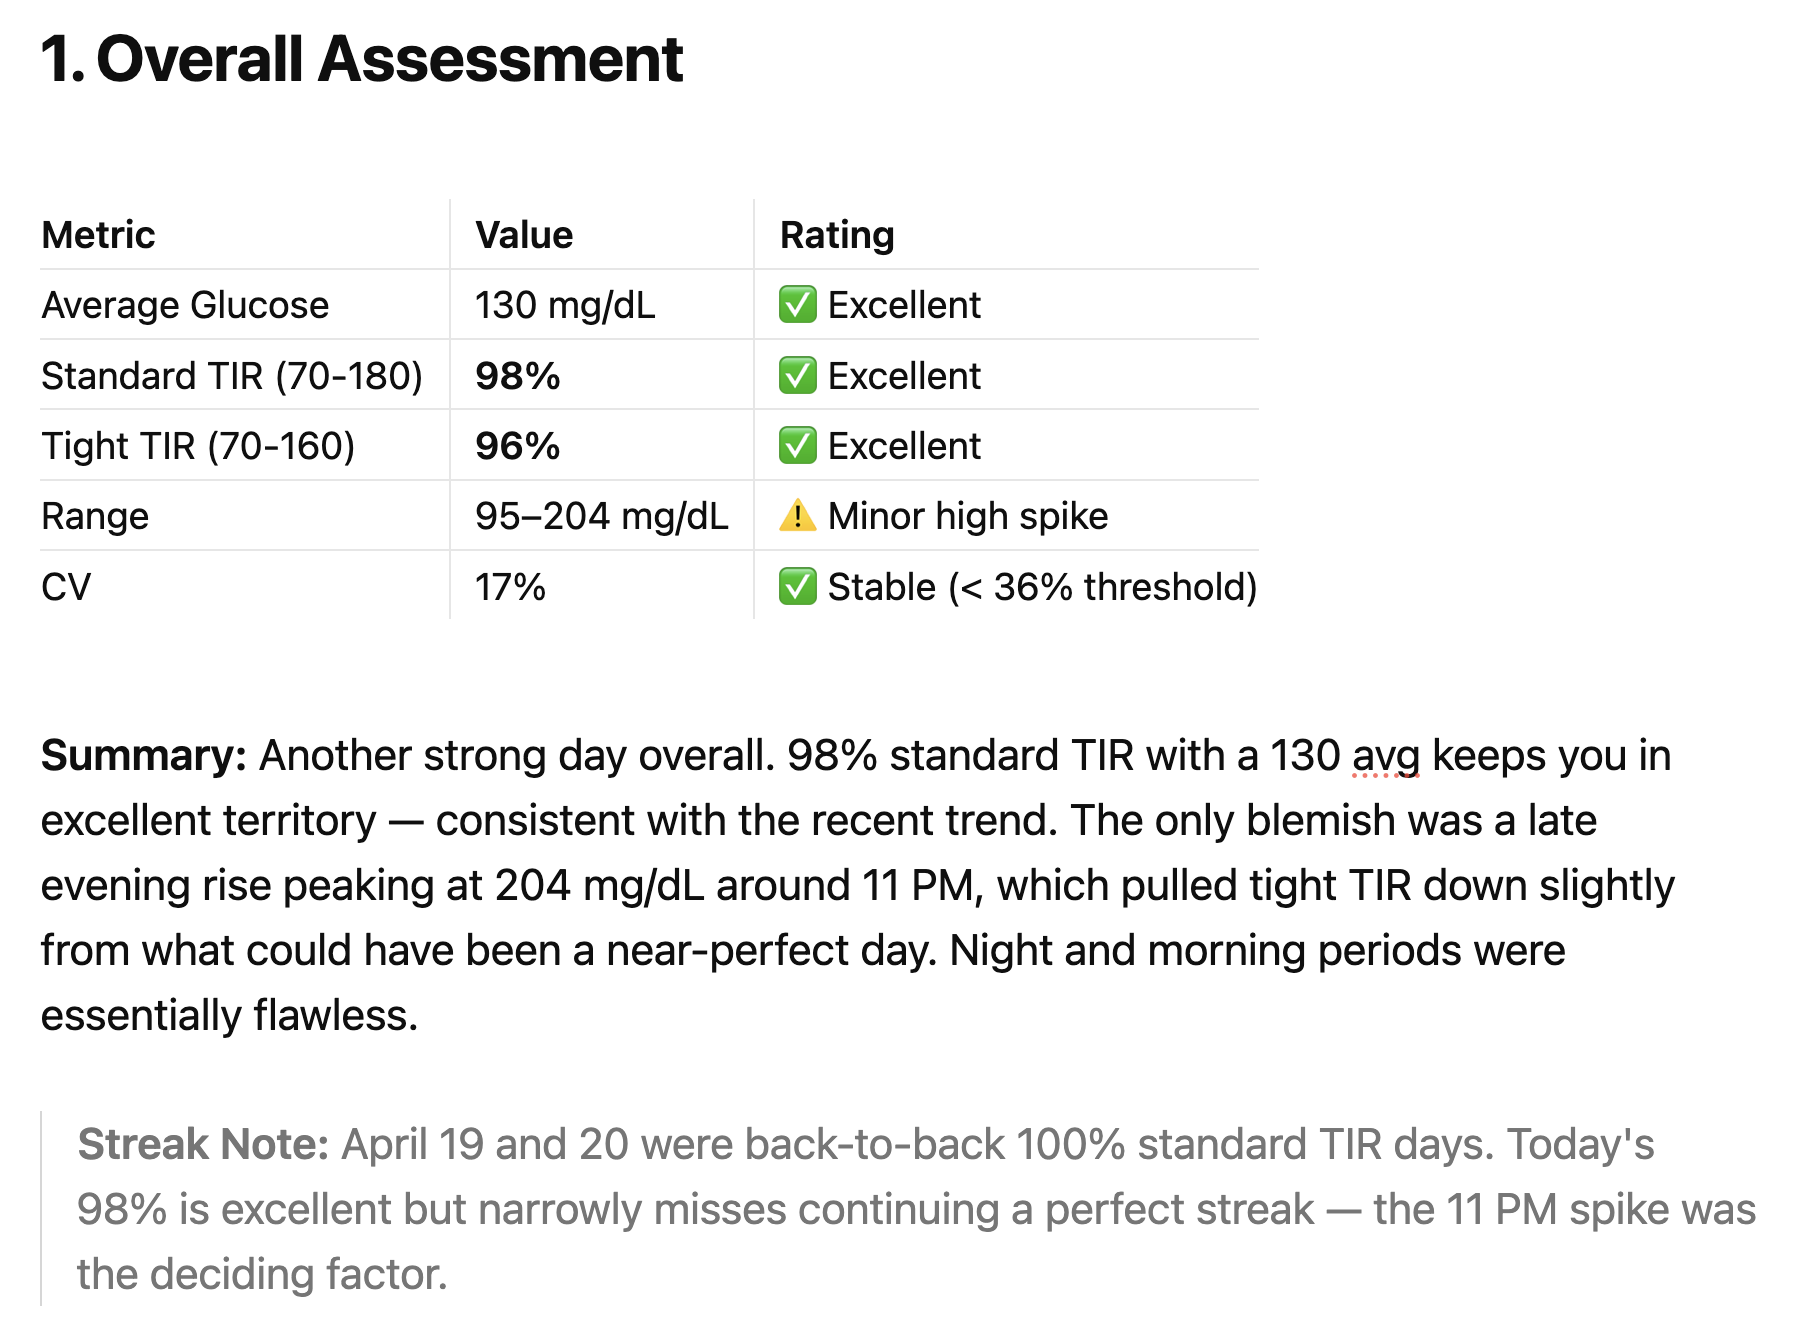
The Meal Analysis for Dinner in section 2 was excellent, until something happened around 11 PM with a glucose spike at 204. Since I had failed to log the Banana Bread snack at 10:13 and took no insulin dose, the data had gaps that need further investigations because it appears unusual.
Reviewing recurring patterns, it mentioned that I might need to review late evening since there have been several recent highs.

In section 4 on Tomorrow's Focus, it identifies that I need to investigate why this happened, and even mentions that initially it couldn't identify what the dinner was because my meal log entry was not recognized. It also suggests that I need to note any late snacks (which I failed to do).

I realized that I never actually logged a Meal at 10:13 PM for Banana Bread with 27g carbs, along with a Note that identified it was a Snack (and a photo). And I updated my Day Diabetes notes with the missing Banana Bread entry, which really explains everything that happened.
I thought that one slice of banana bread is roughly 27g of fast-absorbing carbohydrates — flour, sugar, and ripe banana, all rapid glucose. Starting from 100 mg/dL with no active insulin, that's a formula for a 100+ point rise within 60-90 minutes. I knew this in the abstract. What I didn't have, in the moment, was the number in front of me before I picked it up. I just didn't realize how much it would raise my glucose so quickly.
In fact, I had estimated that a slice of Banana Bread would be about 27g carbs. However, my wife still uses the Better Homes & Gardens New Cookbook (red-and-white checkered ring binder) that was published in 1969 that I gave her for Christmas several years after we were married (and she's still using it!)
Since she used that specific recipe, I thought I would look at it again, but there is no nutrition information on the recipe page (which I have noticed in the past). When I looked it up in the Index, and found it was page 56 in section 3 (Breads).
I went to that section divider and discovered there's actually a Nutrition Analysis table for all recipes in that section right at the beginning (which I never realized for all these years). And Banana Bread has 23g carbs for their recipe, which is baked in an 8x4x2 inch loaf pan and makes 16 servings; so a serving would be 1/16 of a loaf; so how wide a slice is that—maybe 1/2 inch for an 8-inch loaf?
Then I thought I would check the BHG website for their Banana Bread recipe, and I found several. There's an updated modern version (dated 2022) shows 32g carbs. However, I notice it uses a larger 9x5x3 pan and its ingredients are different amounts—sugar: 1C vs 2/3; flour: 2C vs 1 3/4; mashed banana: 1 1/2C (5 bananas) vs 1C (2-3 bananas); and 1/2C walnuts vs 1/4C nuts. There's also an air fryer version in a round cake pan making 8 servings with 29g carbs, as well as another "Classic" one that shows 15g carbs.
- Banana Bread - BHG, 2022, 32g carbs
- Air-Fryer Banana Bread - BHG, 2024, 29g carbs
- How to Make Classic Banana Bread- BHG, 2024, 15g carbs
Other websites like USDA (US Department of Agriculture) lists 33g carbs for a slice (identified as 60g), or the FatSecret website shows 27g for a Banana Bread serving. So it really matters what source and recipe you use for your meals, if you want to really know its nutrition so you have the right carbs to use in insulin dosing for your meals.
Also, I remembered that the Plan to Eat app allows you to add a recipe from a cookbook using an iPhone photo so I created a new Banana Bread PTE recipe. I used its Nutrition Calculator to calculates the nutrition for all the ingredients in the recipe, and that showed 22g carbs (which is fairly closed to the original recipe).
It's not enough just to know the nutrition information for a "serving" with its total carbs, fiber, sugar alcohols, net carbs, protein, fat, and sodium. It's also important to know what is the size (or weight) of that serving, and how many servings the recipe makes.
For example, for a BHG Banana Bread recipe in a 8x4x2 inch loaf that makes 16 servings, a serving would be about a 1/2 inch slice. Sometimes it's more precise to use grams or ounces rather than a vague "slice" since you can use a food scale for quick easy measurements.
That's what a connected recipe database changes. When a recipe's net carbs are visible before eating — not estimated afterward, not looked up separately, but surfaced at the point of decision — the bolus calculation becomes proactive instead of reactive. A 27g snack at 100 mg/dL calls for insulin first, eating second. Skipping that step is what turned a stable evening into a three-hour recovery.
The same principle applies to every meal. The Creamy Spaghetti Bolognese (with shirataki konjac noodles instead of pasta) that works reliably at 12g net carbs behaves differently from a Breakfast Taco estimated as 20 carbs — because the glycemic profile of ground beef with heavy cream is nothing like a low-carb flour tortilla. Net carbs are necessary but not sufficient. Understanding which 12g matters as much as knowing the number.
One more variable matters: timing. Taking insulin 15 minutes before eating — rather than at the first bite — gives it a head start that can dramatically flatten the post-meal curve. The system can prompt this. The recipe can inform the dose. But the timing discipline has to become habit.
That's the intelligence gap the system is designed to close: not just logging what happened, but building enough structured meal and recipe data that the AI coach can start connecting cause to effect — and eventually, help anticipate outcomes before they happen.
What's Next
The recipe database and PKM Recipes app solve the visibility problem — net carbs are now surfaced before meals rather than estimated afterward. But visibility alone doesn't close the loop. The next step is connecting meals to outcomes.
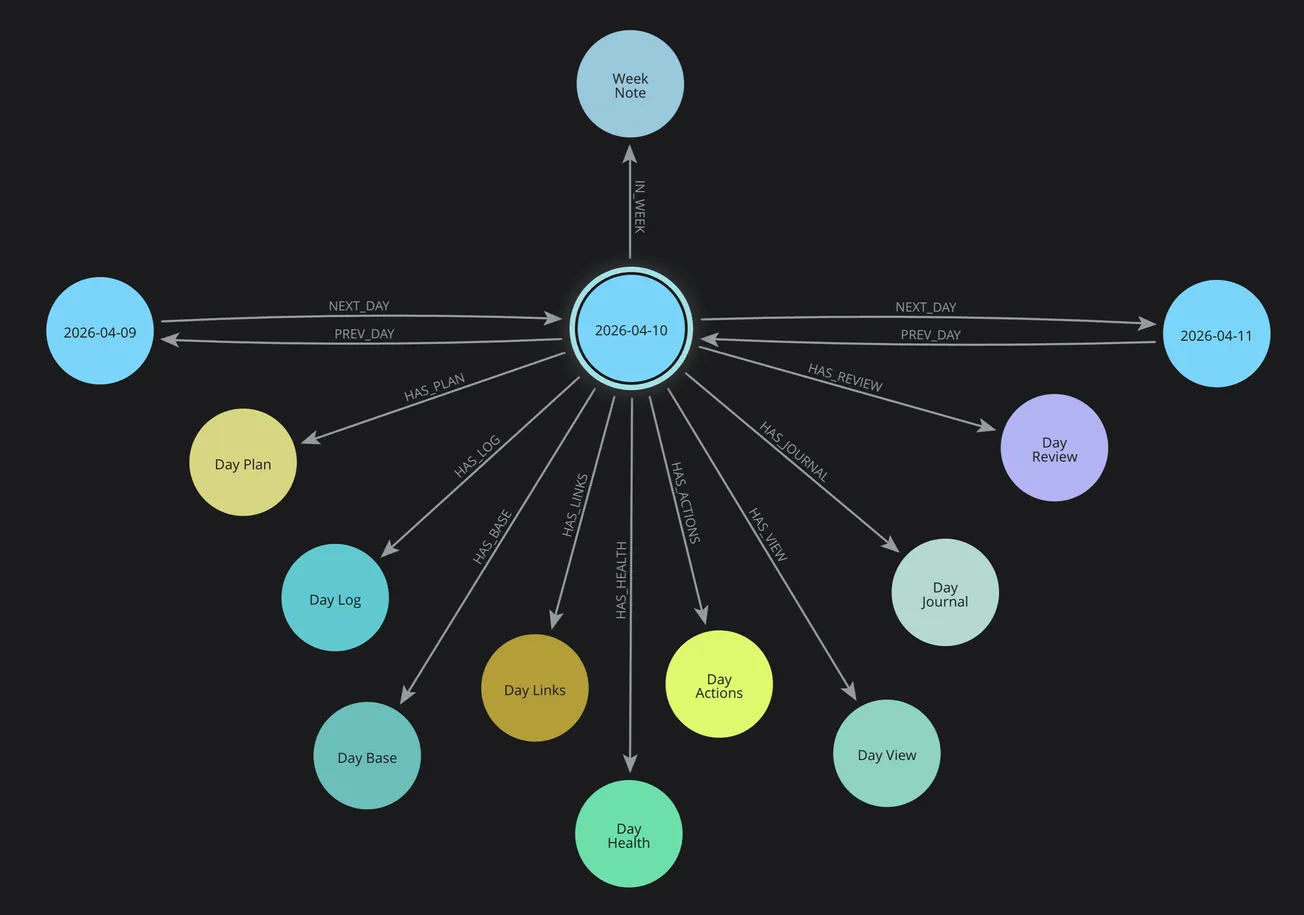
That means extending the Neo4j knowledge graph introduced in Part 4 to include Recipe and Meal nodes alongside the existing Day and Health nodes. When a meal is logged, it links to its recipe, its nutrition data, and the glucose readings that followed. Over time, the graph accumulates something genuinely useful: a personal record of how specific recipes affect my glucose — not population averages, but my actual response to Beef Stew, Nut Granola, and yes, banana bread.
Pattern queries become possible. Which recipes consistently keep me in tight range? Which meals correlate with post-dinner corrections? Does the Creamy Spaghetti Bolognese behave differently on days I walk afterward? The data to answer these questions is already being collected — it just needs the meal layer to connect it.
Part 7 covers the Week Cluster and meal planning workflow — how DMP's weekly meal plan, PTE's shopping list, and the Day Cluster's health tracking combine into a structured weekly rhythm that feeds this intelligence loop.
The PKM structure that organizes all this data for each day is covered in Part 1 of a separate series: 📅 Day Cluster .
And for those who want to build something similar without starting from scratch, a companion post is coming: Claude Projects Setup Guide for Diabetes — practical instructions, sample prompts, and workflow templates for getting your own AI diabetes coach up and running.
The system isn't finished. It's never finished. But it's getting smarter with every meal logged and every glucose curve recorded. That's the point.
Start from the beginning: 🚀 Part 1: The Transformation
