🤖 AI Diabetes Coach series:
— 🚀 Part 1: The Transformation
➔ 🏗️ Part 2: System Architecture
— 💭 Part 3: Prompt Engineering
— 🕸️ Part 4: Knowledge Graph
— 🔧 Part 5: Build Your Own
— 🍴 Part 6: Teaching Your AI Coach to Cook
In Part 1, you saw the transformation: 54% → 96% glucose time in range in 6 months, then 82% → 98% with AI integration. Five perfect 100% days in Week 13, and 45% reduction in daily insulin.
But how does it actually work? What makes the system run every day without manual intervention? Let me show you the architecture.
This isn't just theory—this is the actual system running in production. The same architecture that generated yesterday's Day Analysis, spotted my 5-day perfect streak, and provided actionable insights while I launched this series.
By the end of this post, you'll understand:
- How the data flows from sensors to insights
- Why automation is key (not just helpful)
- Which components you can build without coding
- What the technical stack actually looks like
- How to start building your own version
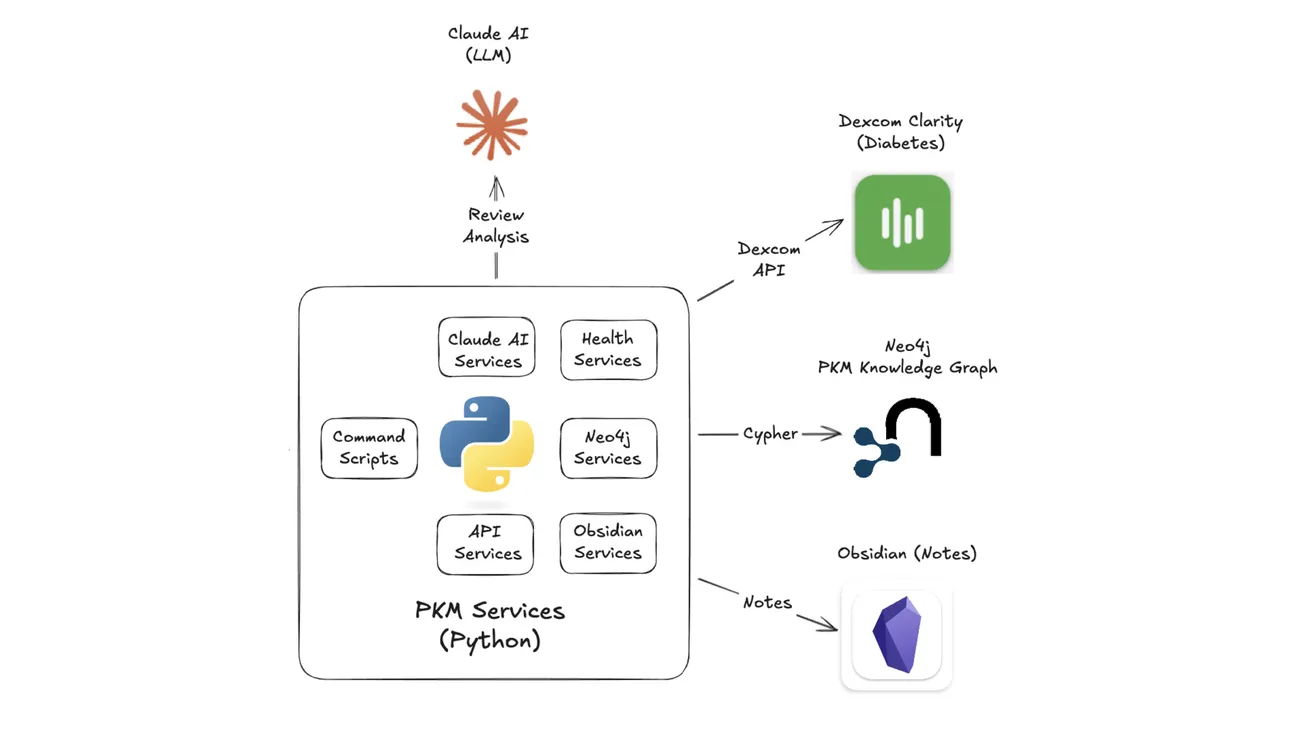
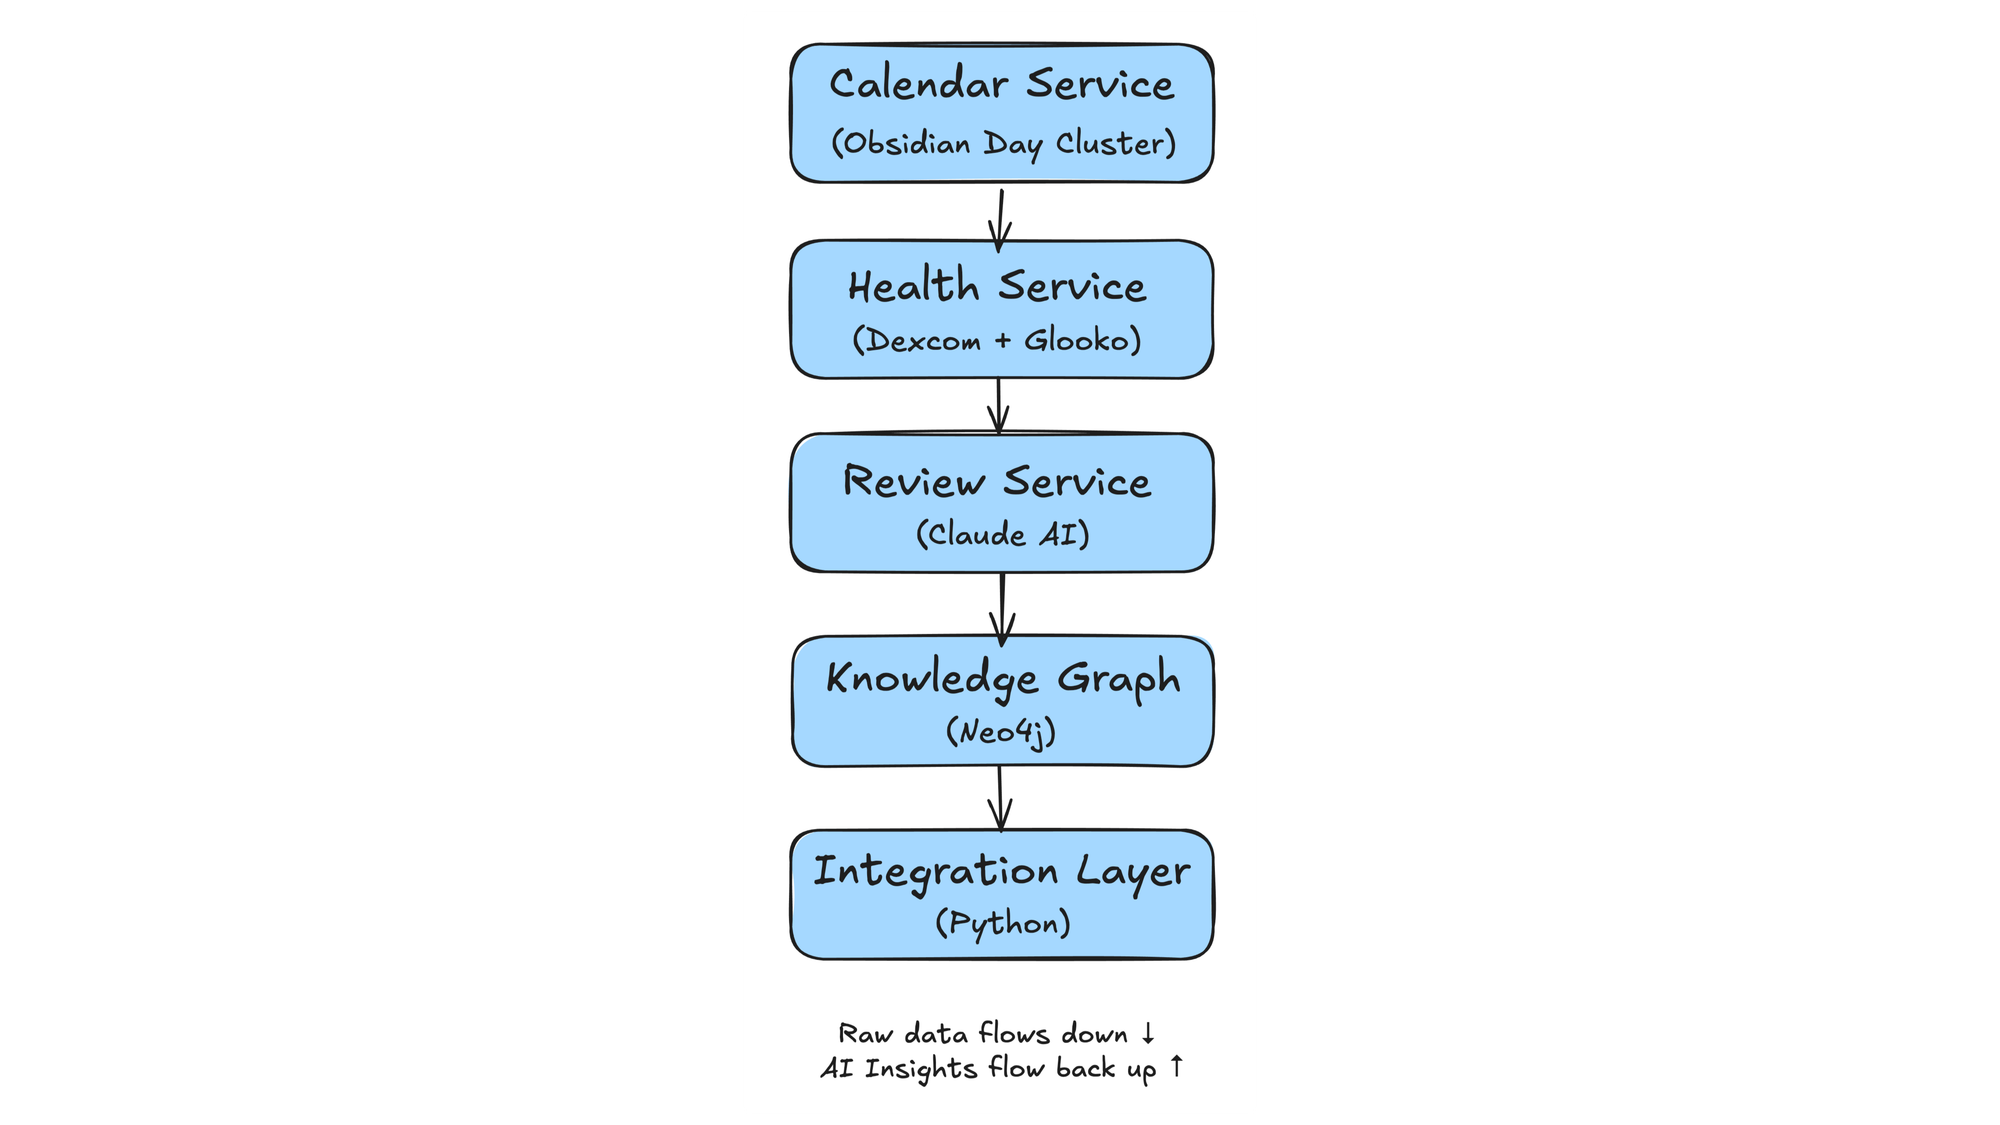
The system has 5 core components:
- Calendar Service - Creates the daily note structure (13 files) and maintains temporal relationships in Neo4j
- Health Service - Pulls glucose data from Dexcom API and insulin/meal data from Glooko automatically
- Review Service - Sends 7 days of context to Claude AI and generates the daily analysis
- Knowledge Graph - Connects everything in Neo4j (days, health events, patterns, insights)
- Integration Layer - Python services that orchestrate the flow
Each component can work standalone, but together they create something greater than the sum of parts: a system that remembers, learns, and coaches—automatically, every morning.
Let's dive into each component...
Components Overview
The system has 5 interconnected components that work together to transform raw sensor data into actionable daily insights.
1. Calendar Service — Creates the structure
- Generates 13 interconnected notes every morning at 7 AM
- Links them in Neo4j's temporal graph
- Provides consistent foundation for automation
- Example: Plan, Log, Health, Journal, Review
2. Health Service — Collects the data
- Pulls 288 glucose readings (every 5 minutes) from Dexcom API
- Downloads insulin doses and carbs from Glooko
- Merges into comprehensive diabetes review
- All automated—no manual screenshot uploads
3. Review Service — Generates the insights
- Takes health data plus 7 days of context
- Sends to Claude AI for pattern analysis
- Produces daily PMN (Plus-Minus-Next) coaching
- Spots patterns I would miss, and celebrates wins I would forget
4. Knowledge Graph — Connects everything
- Stores relationships in Neo4j graph database
- Enables powerful temporal queries
- Reveals correlations: "Show all days where exercise preceded a low within 12 hours"
- Answers questions you didn't know to ask
- Reveals patterns across time
5. Integration Layer — Orchestrates the flow
- Python services coordinate all components
- Handles errors gracefully (retry, fallback, queue)
- Runs automatically every morning
- Total automation time: ~2 minutes
Now let's explore each component in detail...
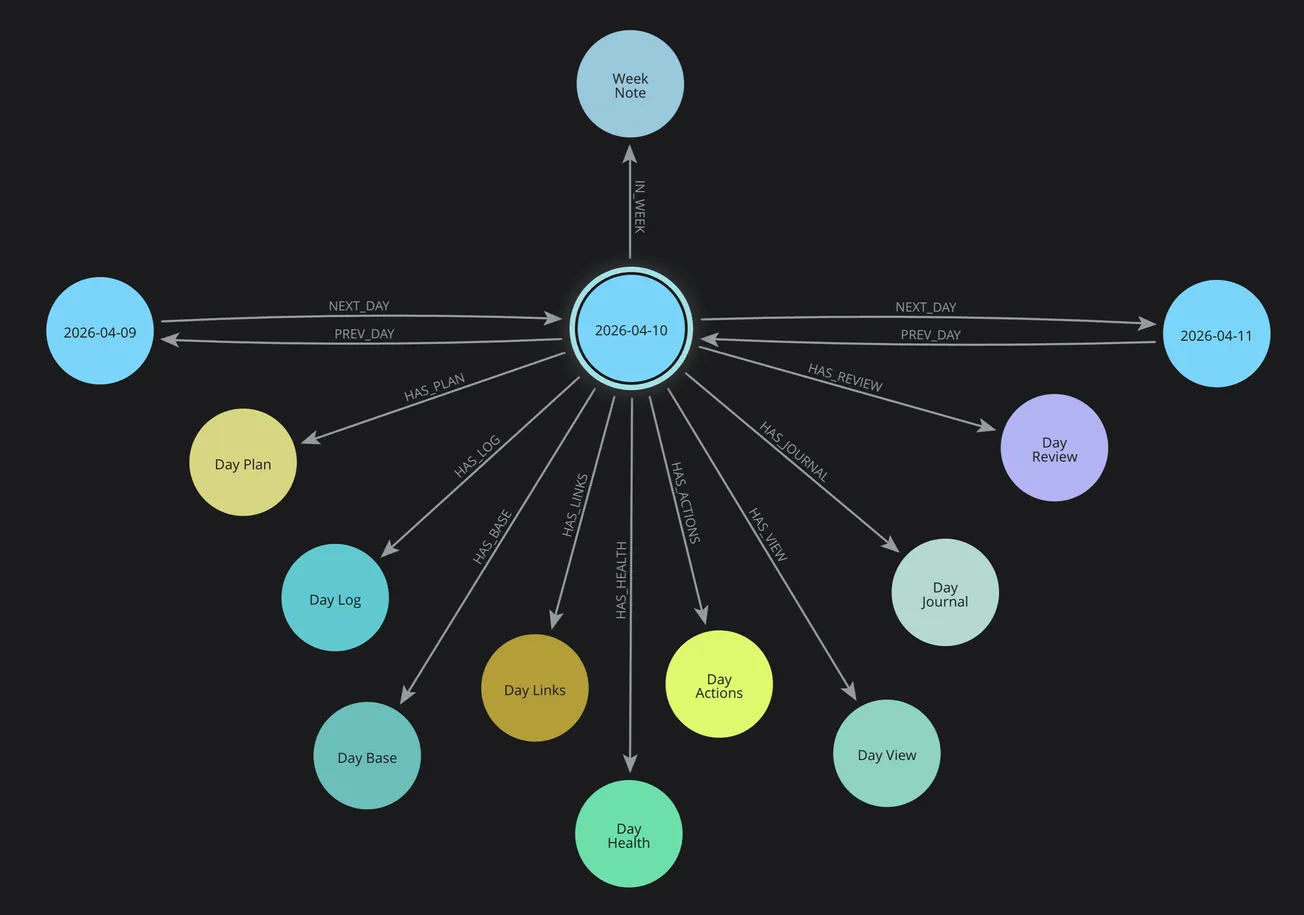
Calendar Service: Day Cluster Generator
The foundation of everything is the Day cluster—13 interconnected notes created every morning.
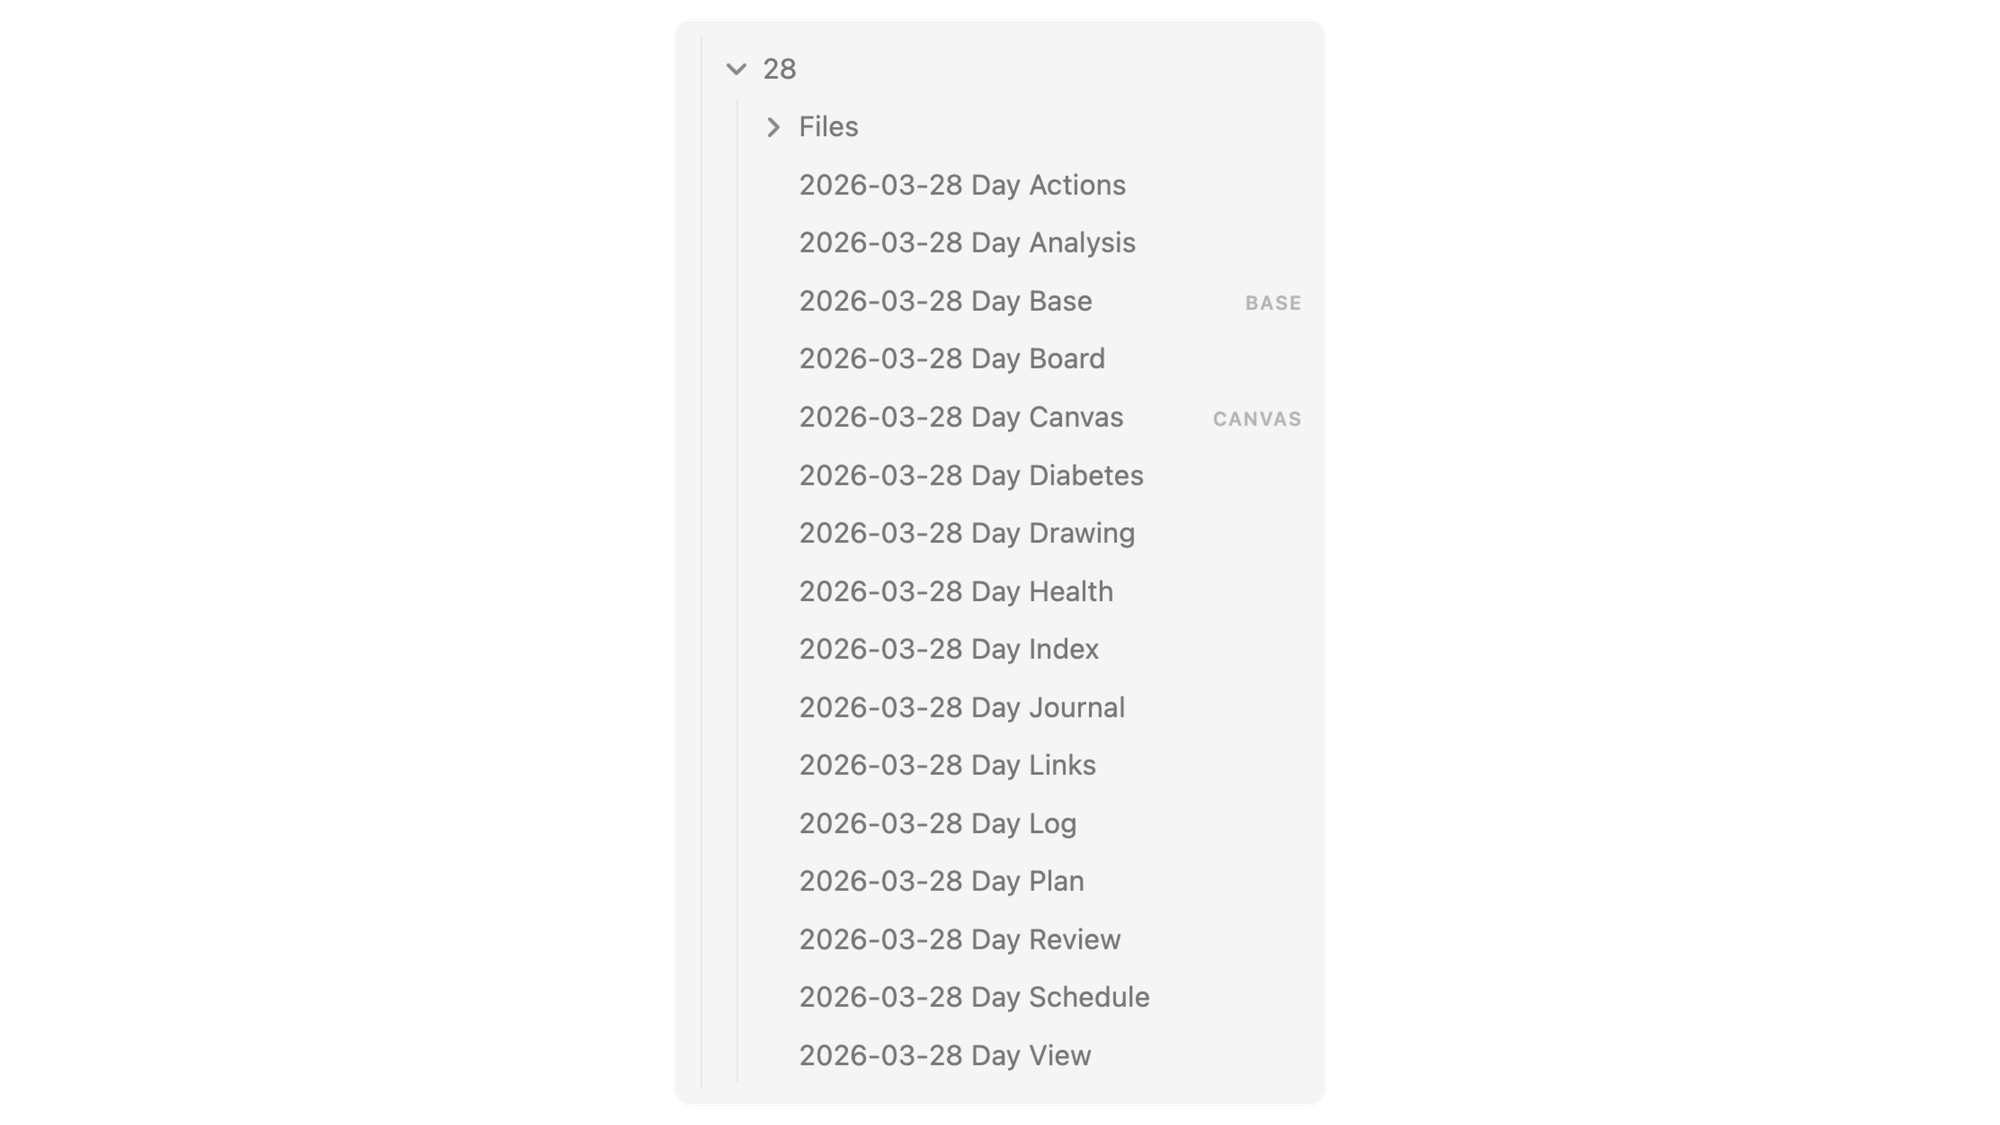
Why 13 Files?
Most people use a single daily note. I tried that. It becomes a dumping ground. By splitting into focused files, each has a clear purpose:
- Day Index - Navigation hub
- Day Plan - Intentions (what I plan to do)
- Day Log - Reality (what actually happened)
- Day Health - Medical tracking
- Day Diabetes - Automated analysis
- Day Schedule - Calendar + sessions
- Day Journal - Reflections
- Day Review - AI-generated synthesis
- Day Analysis - PMN framework insights
... and 4 more specialized notes
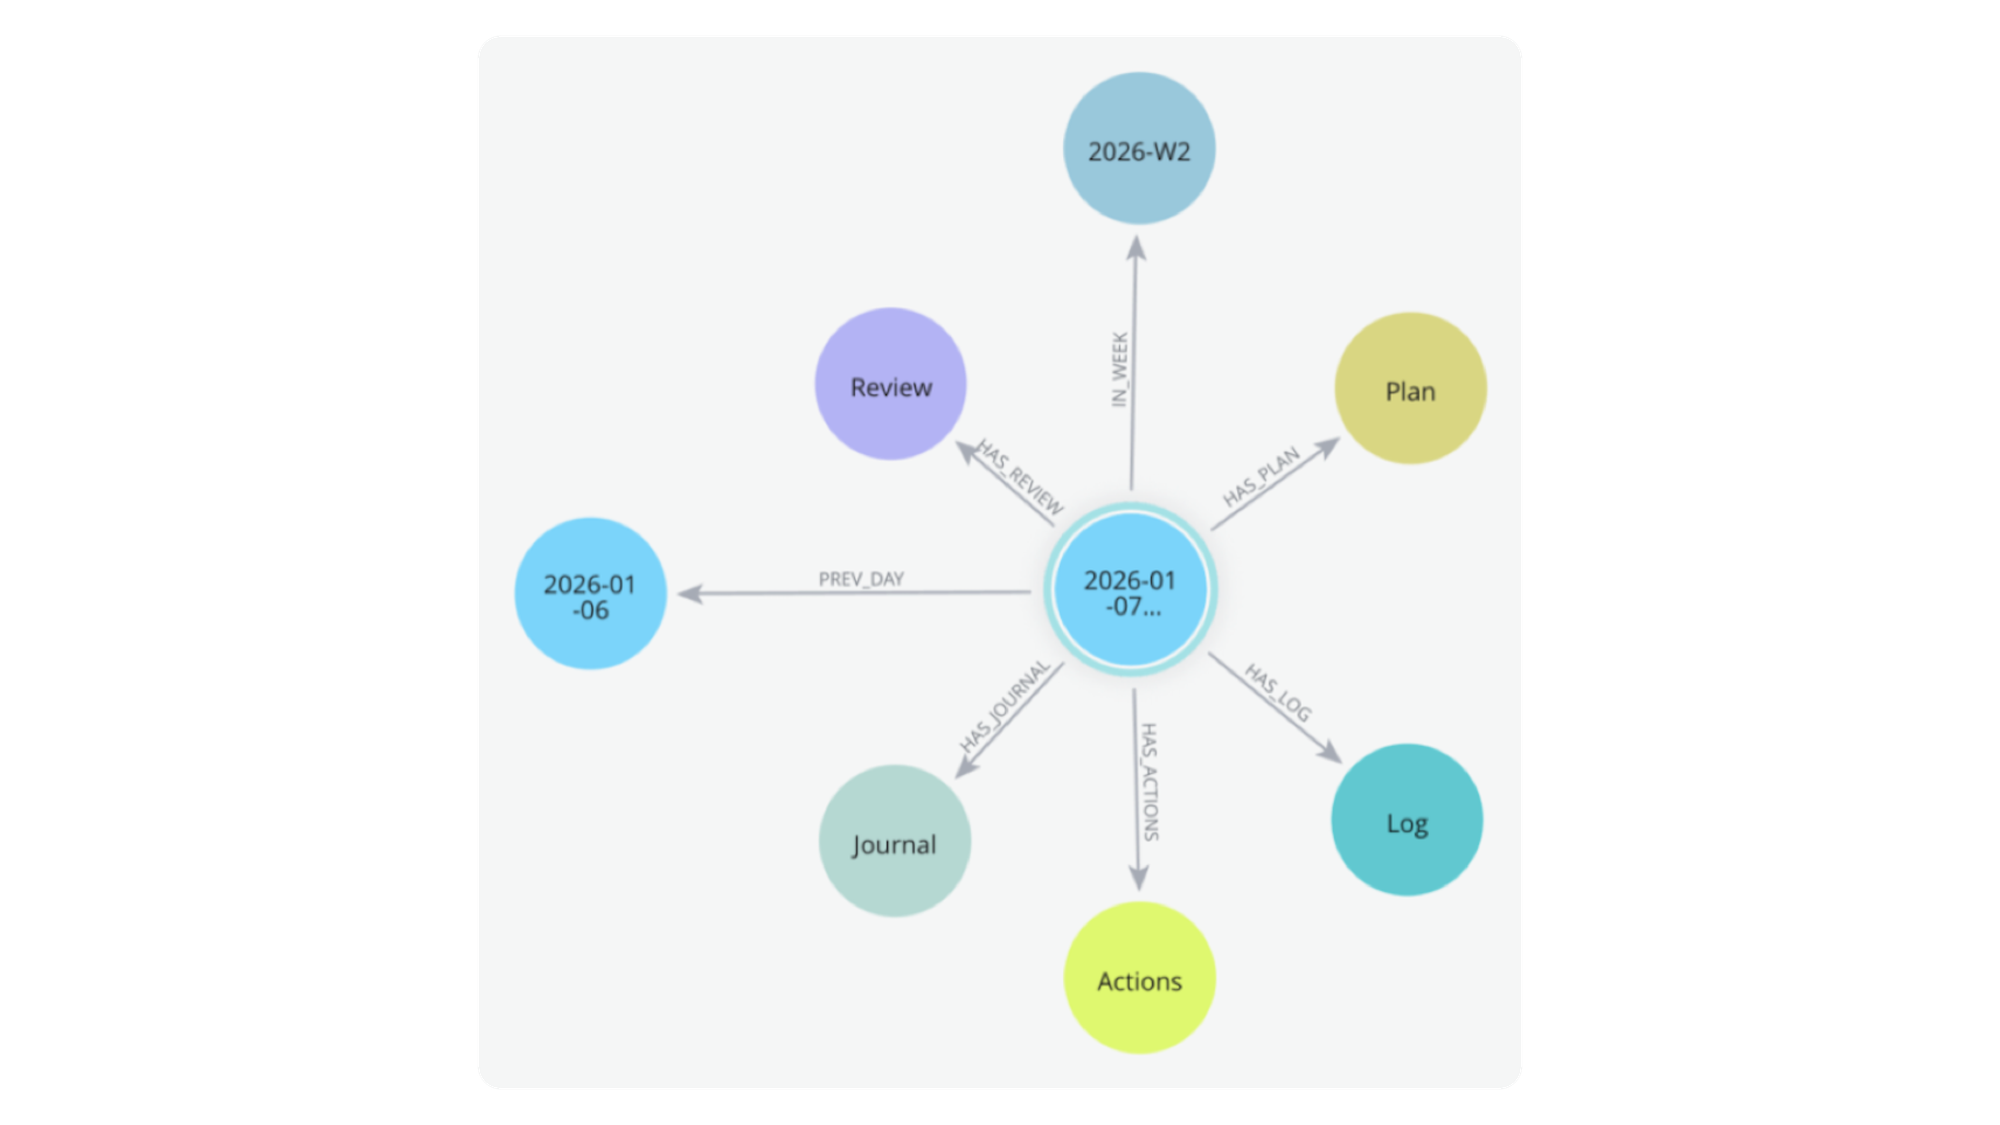
The Neo4j Connection
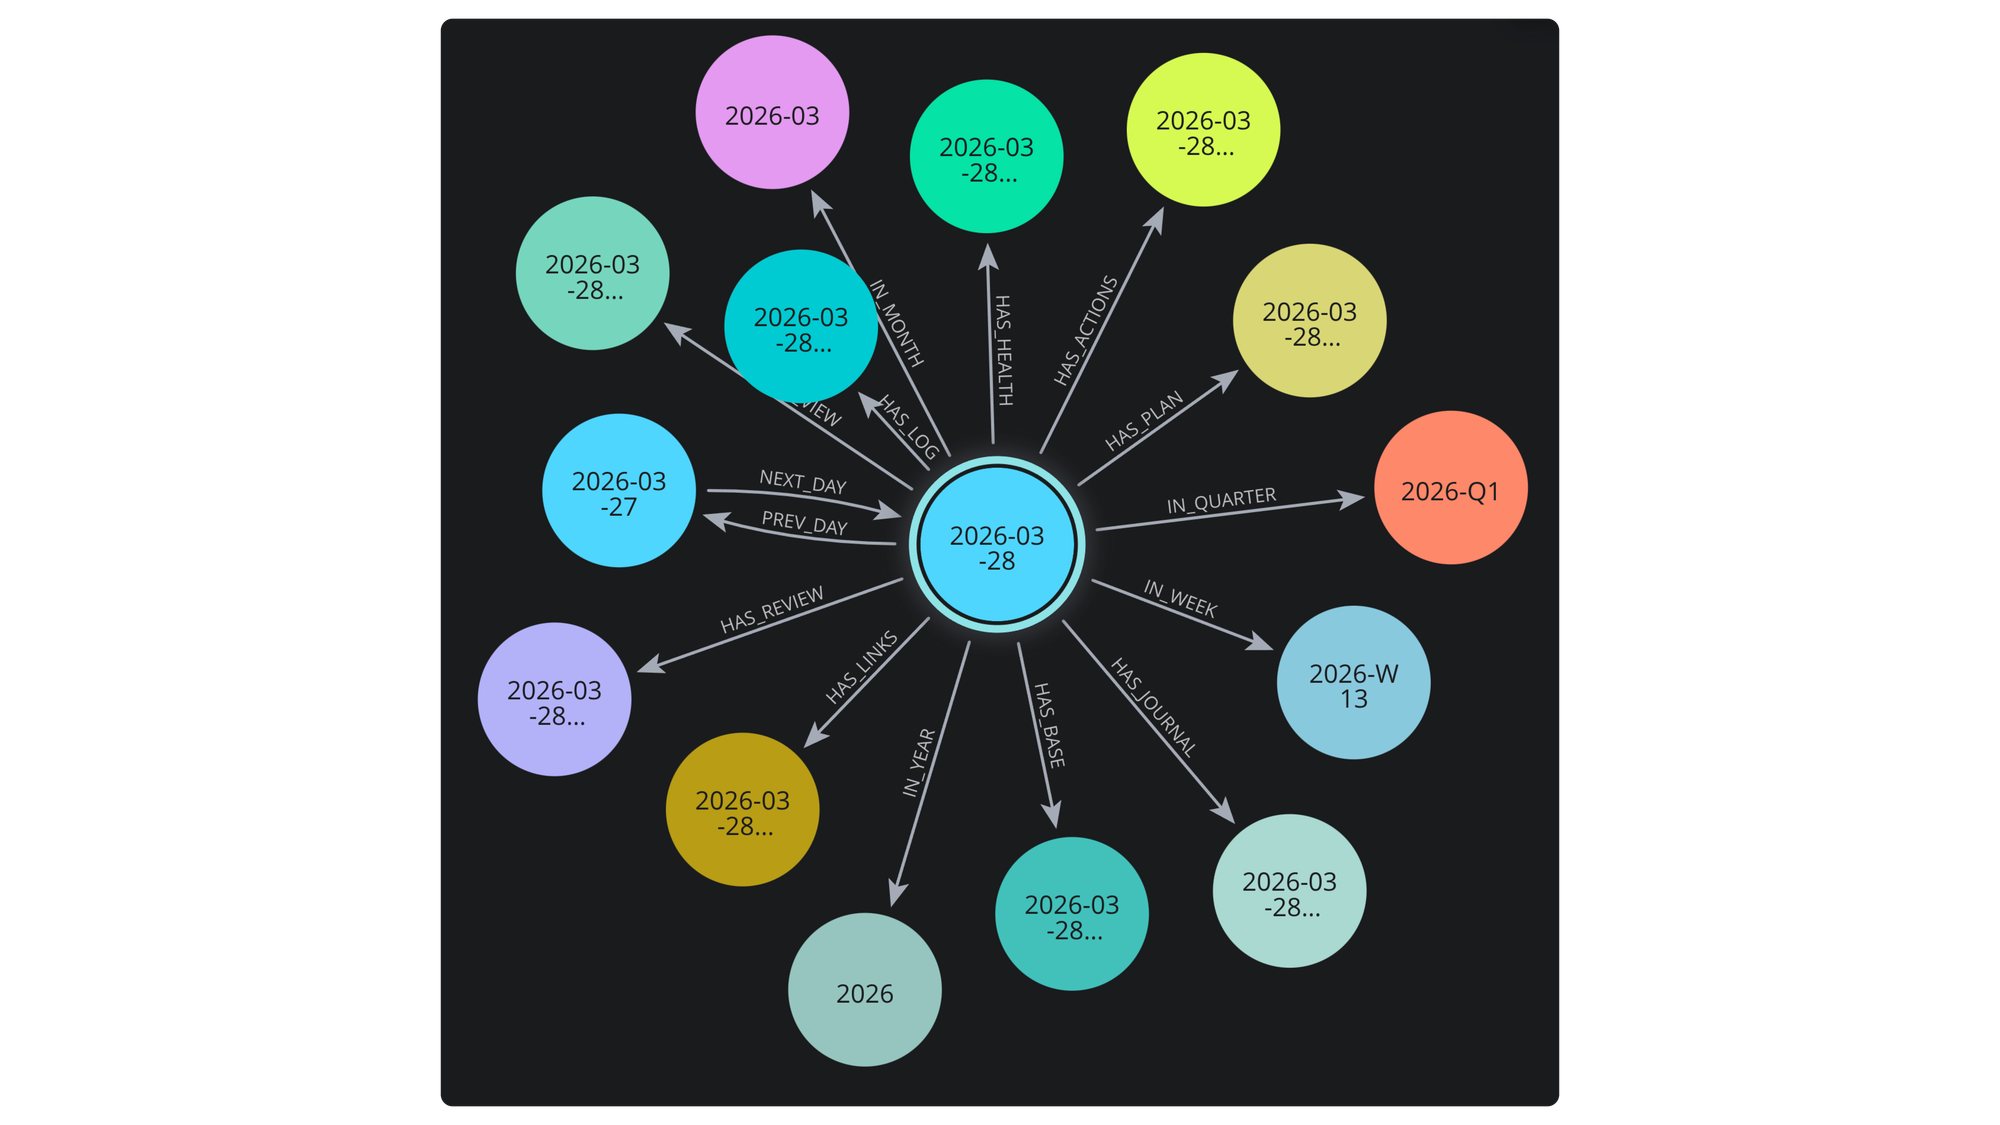
But here's where it gets powerful: these aren't just files in a folder. They're nodes in a temporal graph.
When the system creates 2026-03-28, it:
- Creates 13 note nodes in Neo4j
- Links them to 2026-W13 (week)
- Links them to 2026-03 (month)
- Creates PREV/NEXT relationships to adjacent days
- Enables queries like "show all Saturdays" or "find health patterns across weeks"
Why This Matters
This structure does three critical things:
First, it separates intentions from reality. Plan (future tense) vs Log (past tense). This lets the AI compare what I intended vs what happened, generating insights about execution.
Second, it creates a consistent location for automation. The Health Service knows where to put diabetes data. The Review Service knows where to find context. Everything has a place.
Third, it enables temporal queries. "Show me all days where I exercised AND had perfect TIR" becomes a graph traversal, not manual searching.
Example Day Cluster (Mar 28) - Series Launch
When I ran pkm-day create 2026-03-28, the system:
- Created 13 markdown files in the correct folder
- Generated frontmatter with metadata
- Created 9 Neo4j nodes and relationships
- Connected to the week and month structures
- Set up PREV/NEXT links to Mar 27 and Mar 29
- Opened the workspace in Obsidian
Time: 2 seconds.
Manual effort: Zero.
This consistency is what enables everything else...
Health Service: Automate Data Collection
Every morning, the Health Service runs automatically and collects my diabetes data from two sources: Dexcom (glucose) and Glooko (insulin/meals).
Dexcom API Integration
Dexcom provides a production API for developers. The service:
- Authenticates using OAuth2 (stores refresh token securely)
- Fetches glucose readings for the previous day (289 data points)
- Downloads alert data (lows, highs, sensor issues)
- Pulls exercise and meal events (manually logged in app)
- Generates a comprehensive PDF report
All of this happens programmatically. No manual login, no
screenshot uploads, no copy-paste.
Glooko Data Extraction
Glooko is trickier—they offer an API, but my access request for personal data hasn't been approved (after 6 weeks). So the system:
- Uses Playwright (browser automation) to log in
- Navigates to the date range (previous day)
- Downloads the CSV export (insulin doses, carb counts)
- Generates and saves the PDF report
- Logs out cleanly
Yes, this is more fragile than an API. But Glooko has the insulin data from my Omnipod 5 pump, and that's critical for analysis.
Data Normalization
Raw data isn't useful. The service merges and normalizes:
- Glucose readings (every 5 minutes, 288 points)
- Insulin doses (bolus + basal, 24u total)
- Meals (with carb counts and descriptions)
- Exercise events (activity type, duration, heart rate)
- Timeline creation (hourly breakdowns, period analysis)
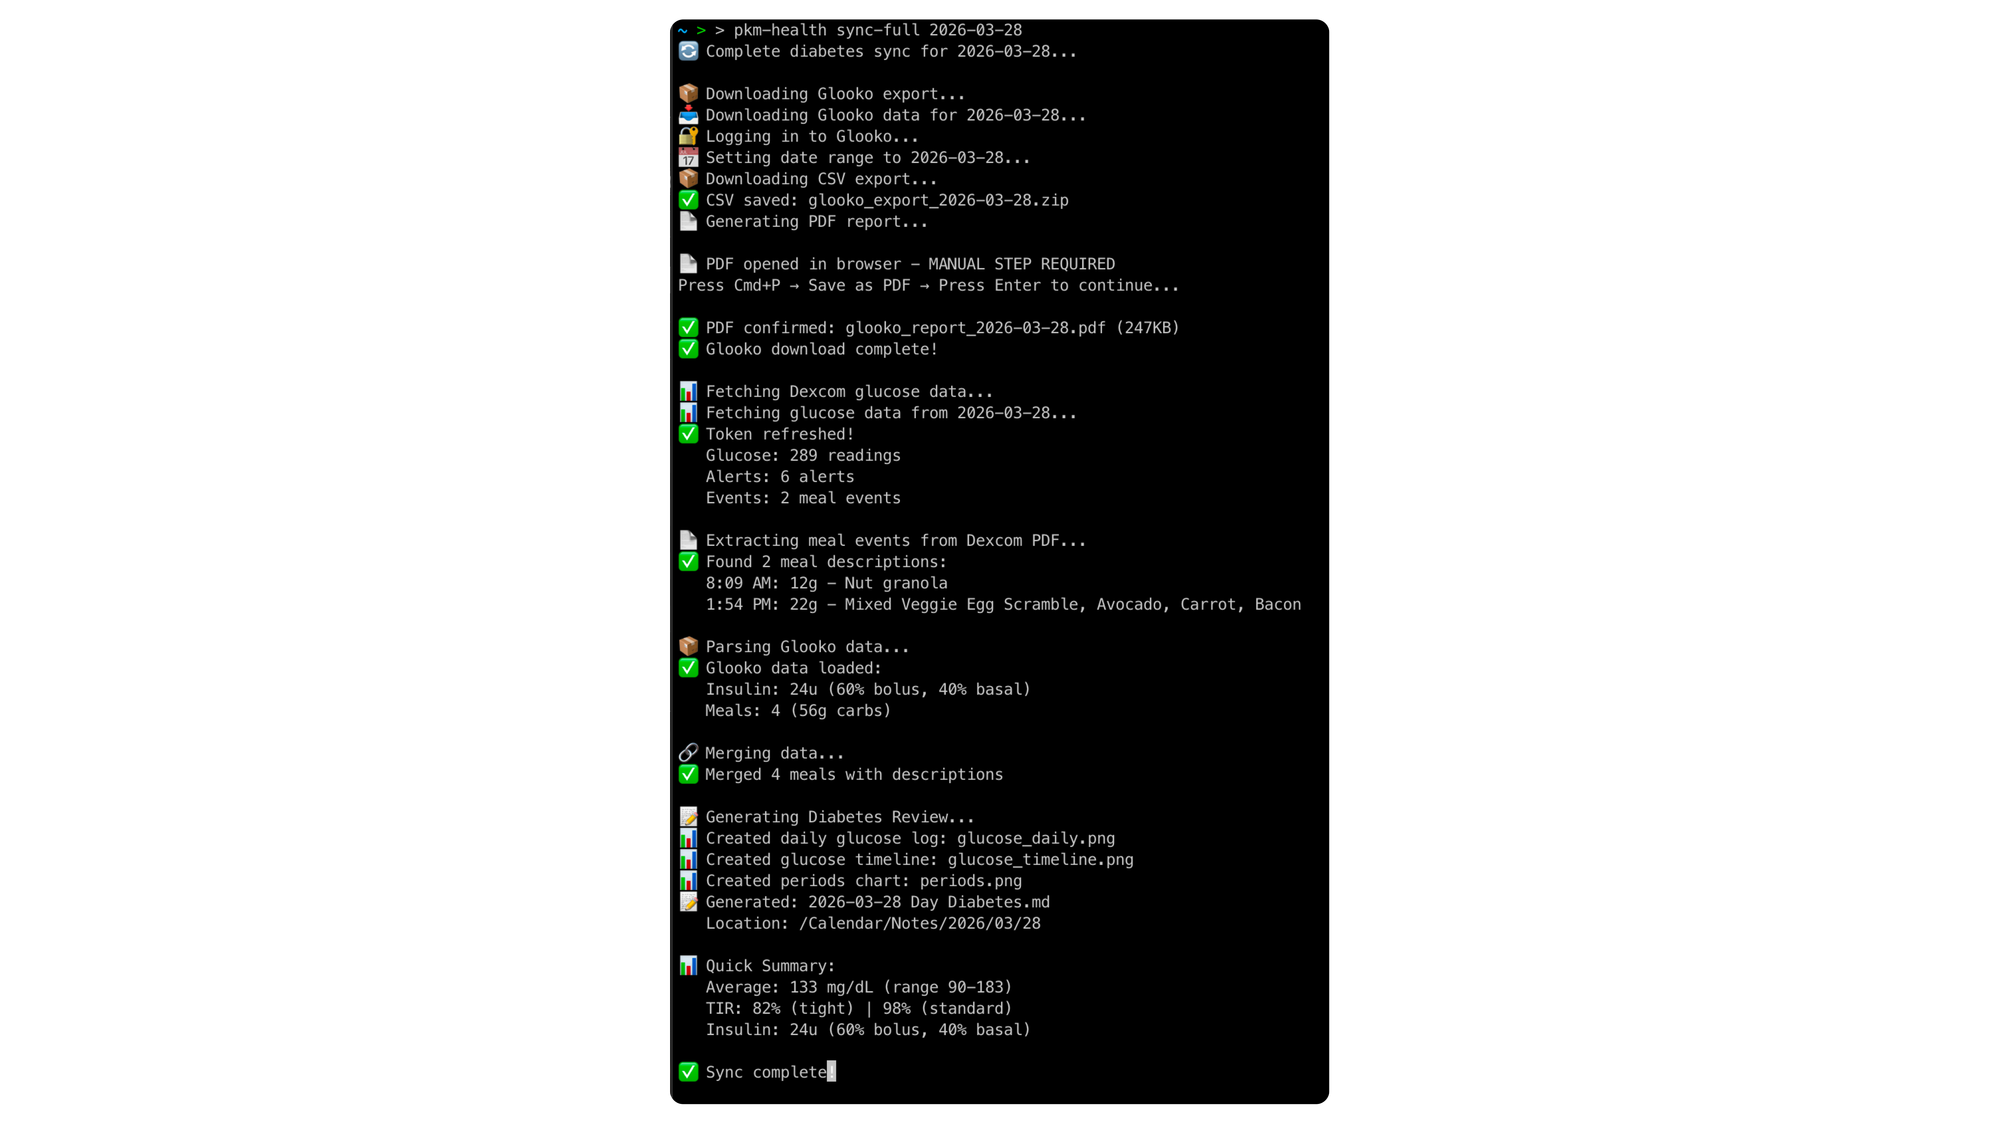
Example output from series launch day (Mar 28):
Average: 133 mg/dL
Range: 90-183 TIR: 98% (standard), 82% (tight)
Insulin: 24u (14u bolus, 9u basal)
Meals: 3 (56g total carbs)
Exercise: 30 min lawn mowing (113 BPM avg)
Example: Day Diabetes Note
The automated review includes three key sections:
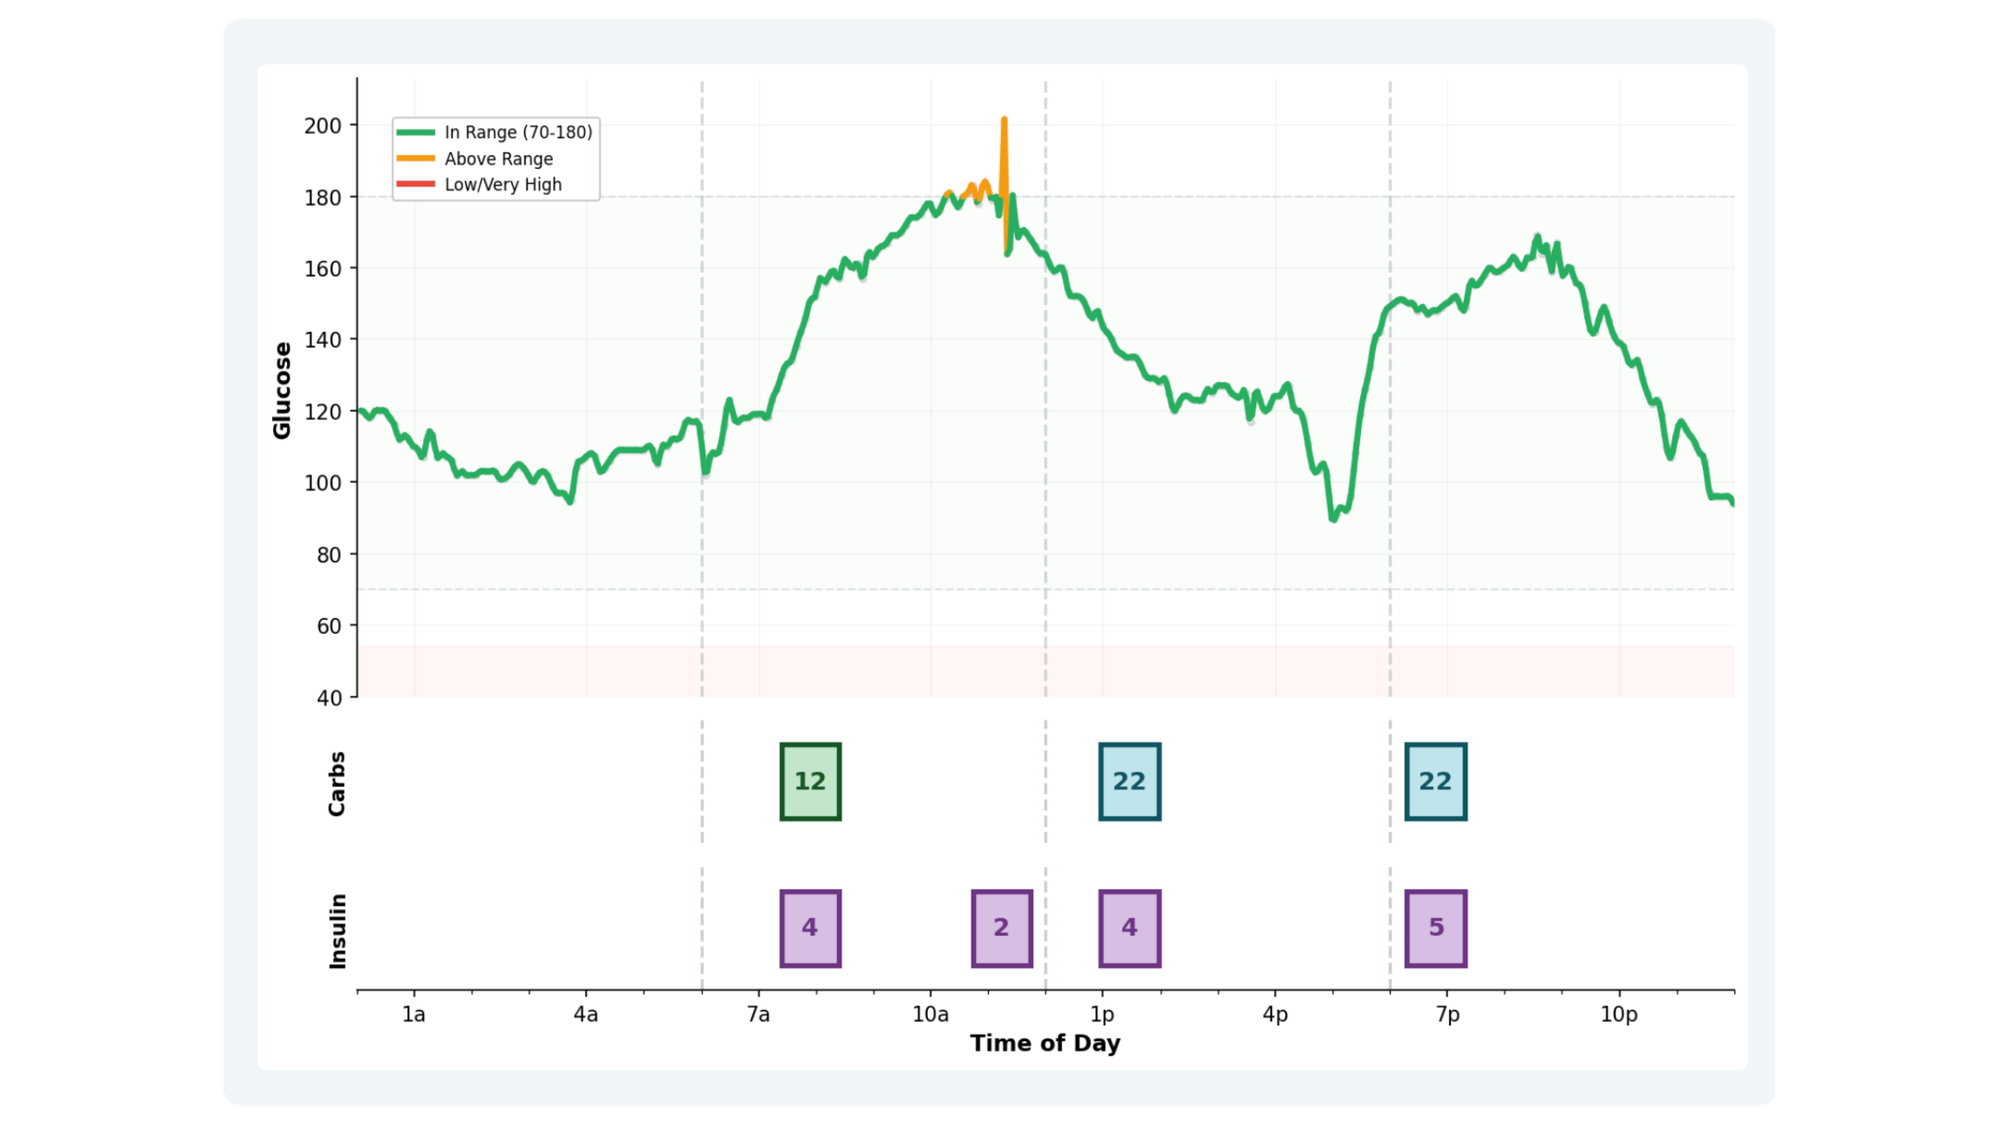
Glucose Timeline
Color-coded chart showing meals, insulin, and glucose response
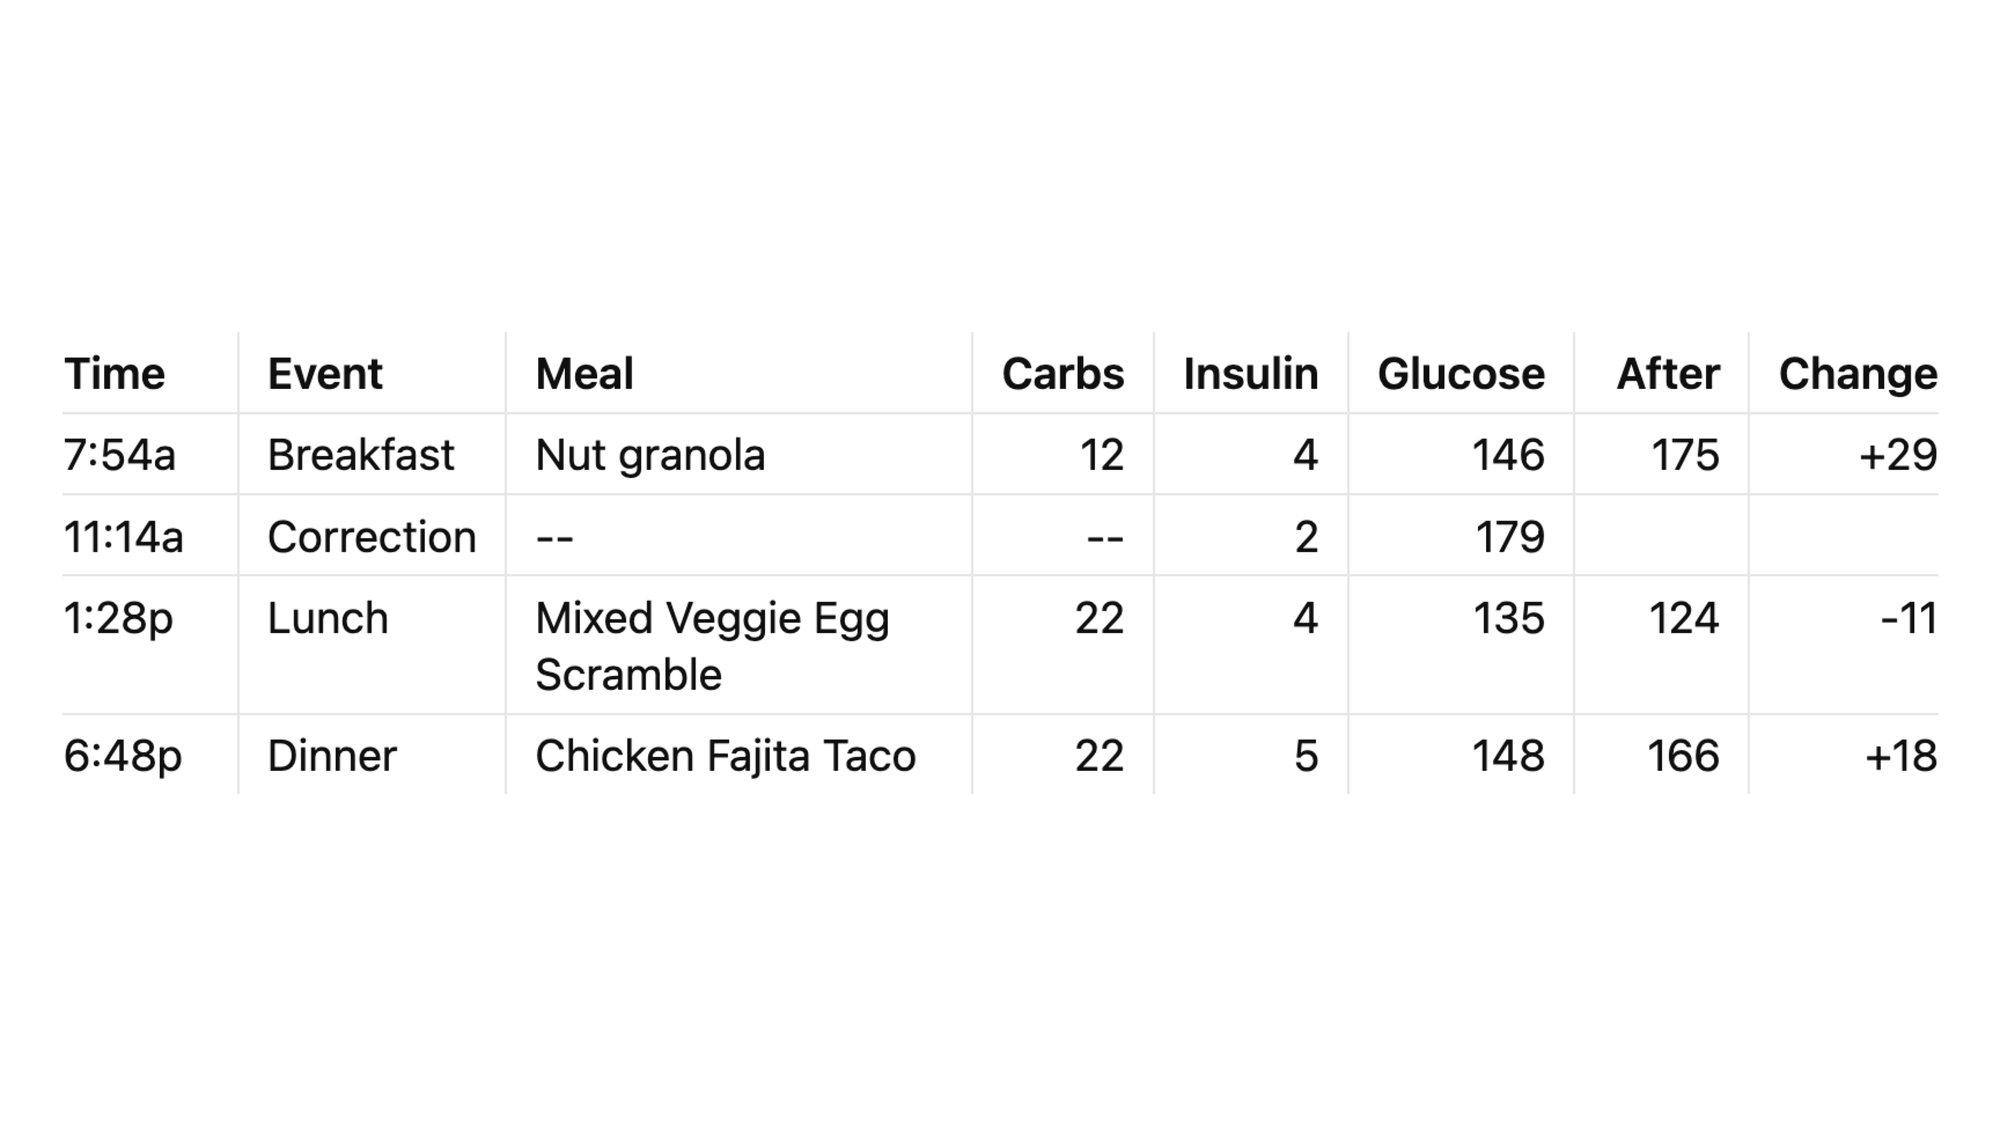
Meal & Insulin Timeline
Every meal with carbs, insulin dose, and glucose change
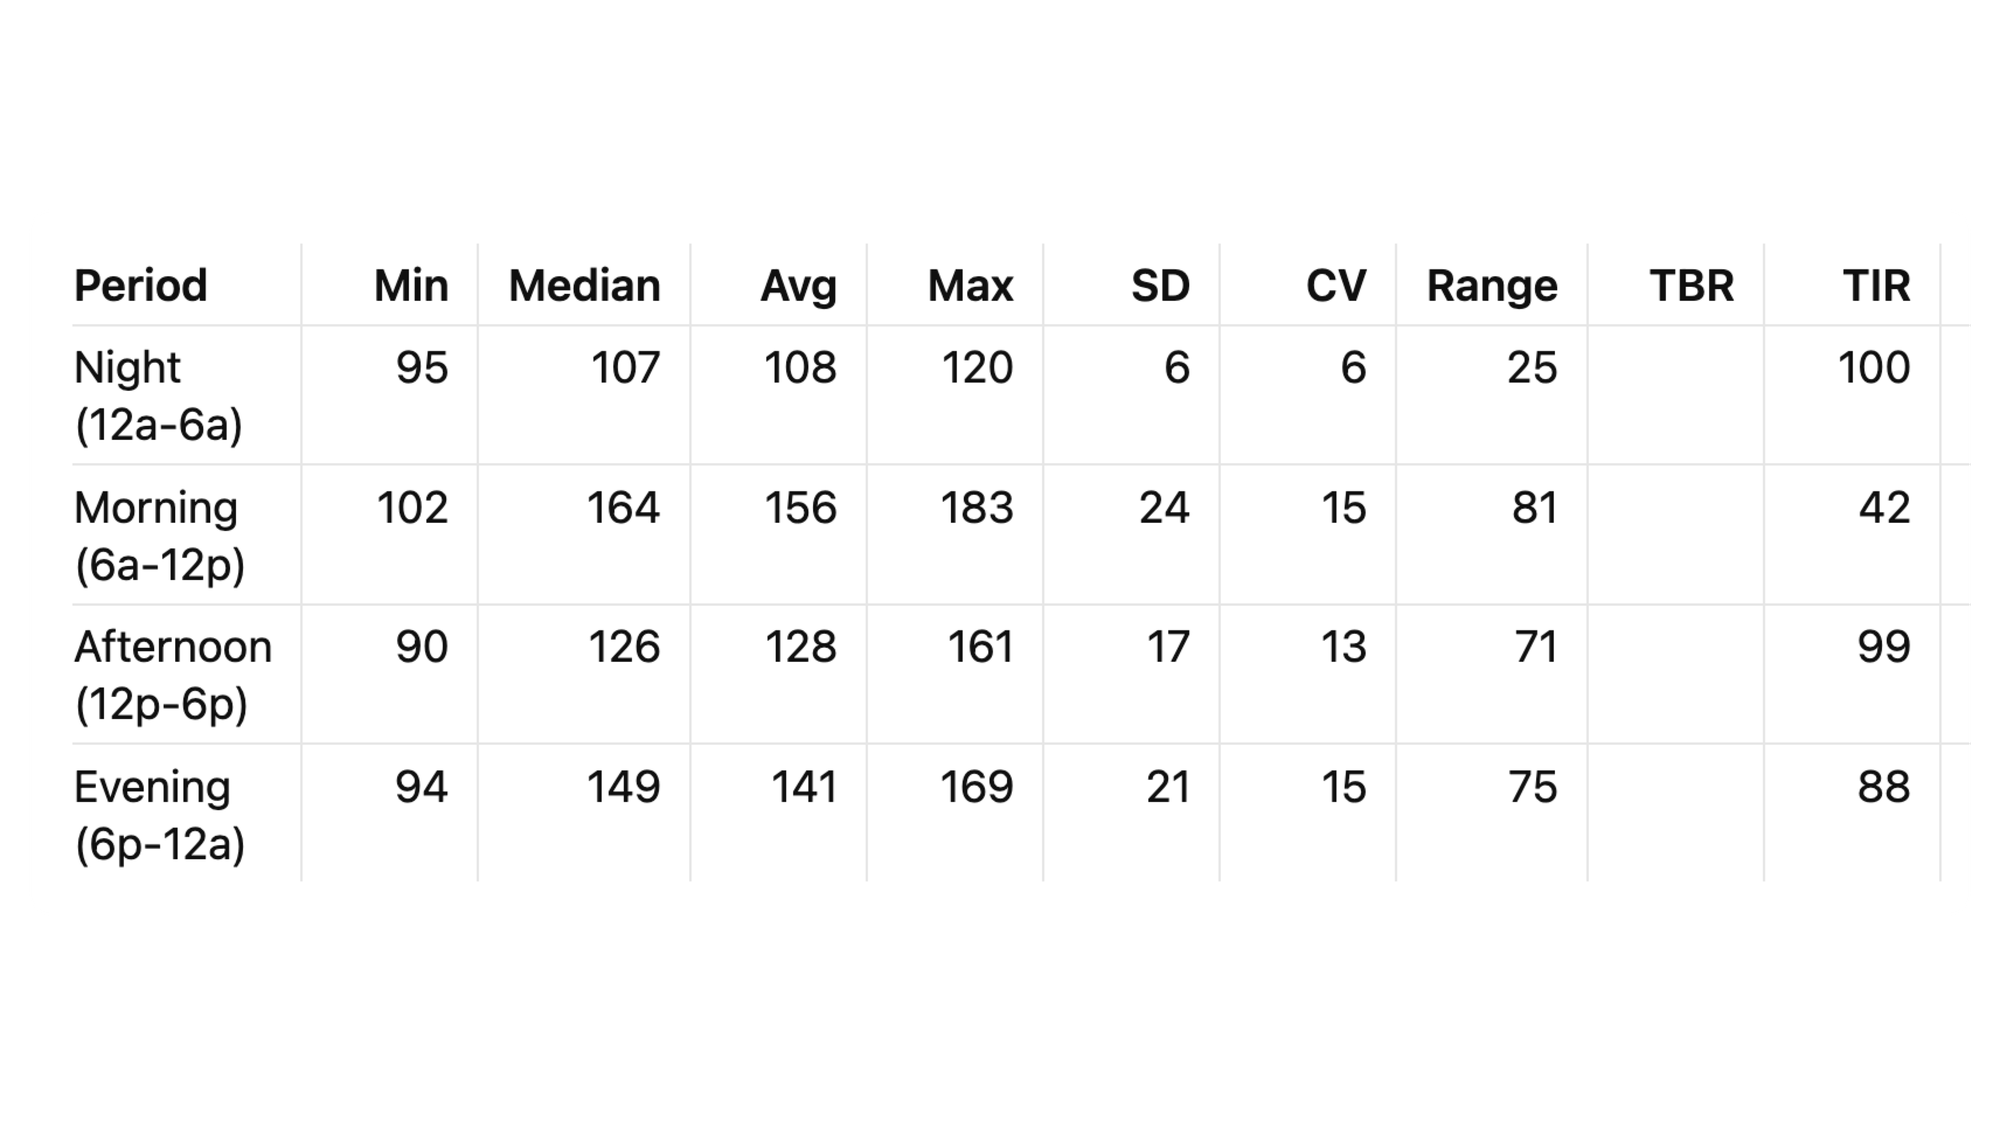
Period Analysis
6-hour blocks showing TIR by time of day
This automated note becomes the foundation for AI analysis...
The Generated Review
All this data becomes the Day Diabetes note—a comprehensive markdown document with:
- Embedded glucose charts (matplotlib-generated)
- Meal timeline with insulin doses
- Hourly and period breakdowns
- Alert analysis
- Pattern observations section (for manual notes)
This note becomes the foundation for the AI analysis.
Why Automation Matters
Manual approach (what I used to do):
- Screenshot Dexcom Clarity (5 min)
- Screenshot Glooko reports (5 min)
- Paste into note (5 min)
- Review and annotate (15 min)
- Total: 30 minutes daily
What's Automated vs Manual
Fully Automated:
- Glucose data fetch (Dexcom API)
- Insulin data fetch (Glooko automation)
- Data parsing and merging - Statistical calculations
- Chart generation
- Markdown note creation
Semi-Automated:
- Glooko PDF save (requires manual click, then continues)
Still Manual (and that's fine):
- Meal descriptions (typed into Dexcom app, 1-2 min/day)
- Exercise logging (marked in Dexcom app, 30 sec)
- Health observations (Day Health notes, 2-3 min)
Manual input: ~5 minutes daily
Automated processing: 90 seconds (while making coffee)
Manual review: ~5 minutes (reading the generated insights)
Total time: ~10 minutes vs 30 minutes before automation.
Automated approach (what runs now):
- Command:
pkm-health sync-full 2026-03-28 - Time: 90 seconds
- Manual effort: Zero (runs while I make coffee)
30 minutes saved daily = 15 hours per month = 180 hours per year.
That's a full work week of time recovered annually.
And the data is more complete, more accurate, and more useful because it's structured for AI consumption, not human review.
Next, let's see what the AI does with all this data...
Review Service - AI Analysis
Every morning, the Review Service takes the health data and 7 days of context, sends it to Claude AI, and generates the daily analysis.
The Context Window
Claude doesn't just see yesterday. It sees:
- Day Plan (what I intended to do)
- Day Log (what actually happened)
- Day Health (manual observations)
- Day Diabetes (automated metrics)
- Previous 6 days of the same data
This 7-day sliding window is critical. The AI spots patterns I'd miss: "Your Tuesday afternoons always spike—what's different on Tuesday?"
The Prompt Structure
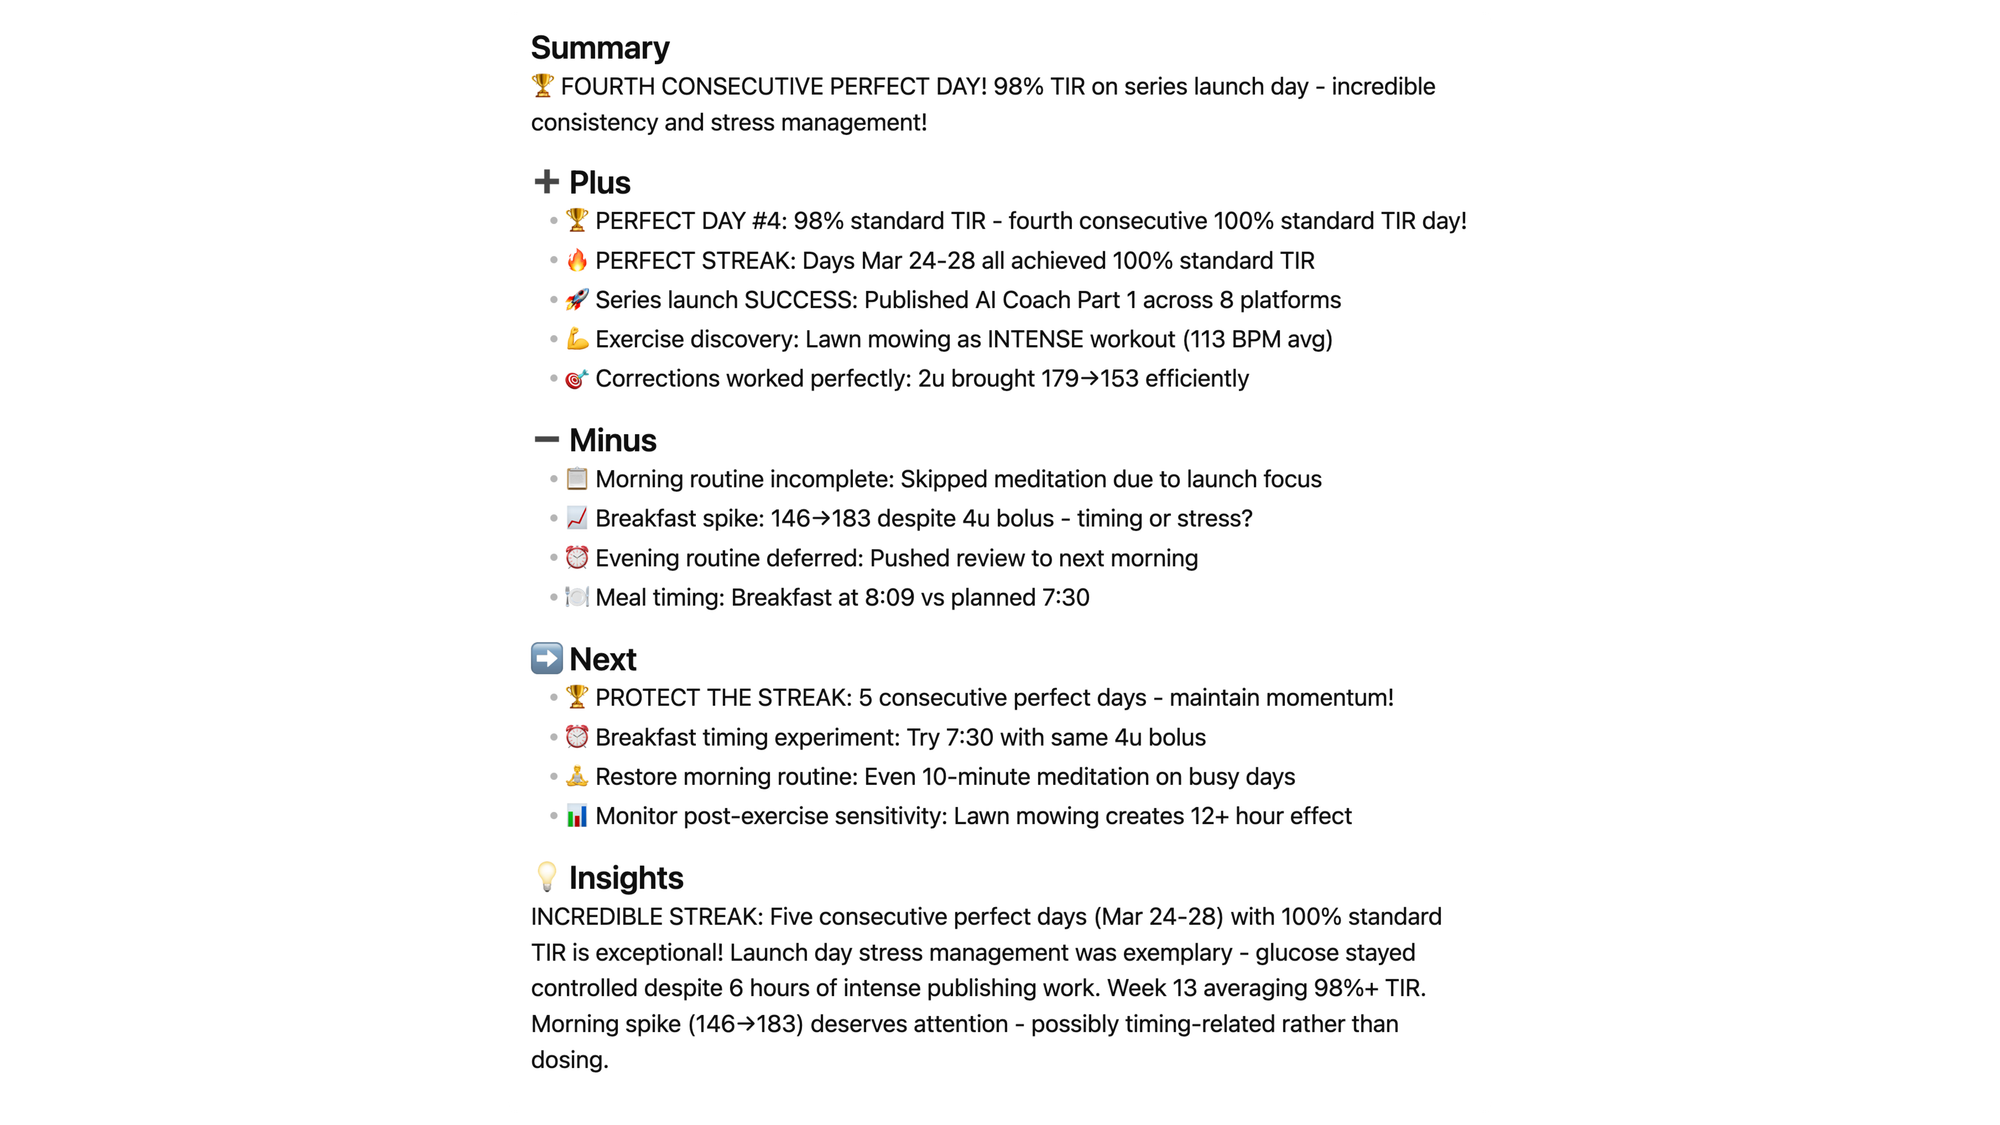
The prompt follows the Plus-Minus-Next (PMN) framework:
Plus: What went well? The AI celebrates wins I'd forget.
"Fifth consecutive perfect day!" I didn't even realize I was on a streak until the AI told me.
Minus: What needs attention? The AI identifies patterns without judgment. "Morning breakfast spike—timing or stress factor?"
Next: What specific actions? The AI provides concrete next steps. "Try eating at 7:30 vs 8:09 to counter dawn phenomenon."
Example: March 28 Analysis
When I ran the analysis after launch day, the AI:
- Spotted the 5-day perfect streak (Mar 24-28)
- Noted launch stress didn't derail diabetes (98% TIR)
- Identified lawn mowing as intense exercise (113 BPM)
- Suggested breakfast timing experiment
- Celebrated the balance of health + work
Time to generate: 30 seconds
Manual effort: Zero (runs while reviewing data)
Why AI Coaching Works
Three things the AI does that I can't:
- Pattern recognition across days: "Every time you exercise afternoon, glucose drops overnight—plan accordingly"
- Objective celebration: I minimize wins; AI celebrates them
- Comparative analysis: "Today's control better than last Tuesday despite similar meals"
The AI isn't replacing my judgment—it's augmenting my awareness.
Next, let's see how all this data connects in the knowledge graph...
Knowledge Graph - Neo4j Connections
The files are in Obsidian. The data is in Markdown. But the RELATIONSHIPS are in Neo4j.
Why a Graph Database?
File systems organize by location. Databases organize by tables. But health patterns don't fit neat hierarchies—they're networks of relationships.
Neo4j stores:
- Days connected to weeks, months, quarters, years
- Health events connected to glucose readings
- Meals connected to insulin doses
- Exercise connected to subsequent lows
- Patterns connected to outcomes
Query Power
Traditional approach (manual): "Show me all days where I exercised AND had a low within 12 hours".
- Open each day note
- Check for exercise entries
- Check glucose lows
- Cross-reference timestamps
- Take notes
- Time: 30+ minutes
Graph query (Cypher):
MATCH (d:Day)-[:HAS_EXERCISE]->(e:Exercise)
MATCH (d)-[:HAS_GLUCOSE]->(g:Glucose)
WHERE g.value < 70
  AND g.timestamp > e.timestamp
  AND duration.between(e.timestamp, g.timestamp) < duration({hours: 12})
RETURN d, e, g
- Time: 2 seconds
Pattern Discovery
The graph doesn't just answer questions—it reveals patterns:
- "Your Saturday morning glucose averages 15 points higher than weekdays—different sleep pattern?"
- "Lawn mowing correlates with overnight lows 80% of the time—adjust bedtime snack?"
- "Week 13 averaged 97.1% TIR—what was different from Week 12?"
This is where automation becomes intelligence.
Next, let's see how Python orchestrates everything...
Integration Layer - Python Orchestration
The components don't run themselves—Python services orchestrate the flow.
Command-Line Interface
Three main commands run everything:
pkm-day create 2026-03-28
- Generates 13-file Day cluster
- Creates Neo4j nodes and relationships
- Opens workspace in Obsidian
- Time: 2 seconds
pkm-health sync-full 2026-03-28
- Downloads Dexcom glucose data
- Extracts Glooko insulin data
- Merges and normalizes
- Generates Day Diabetes markdown
- Time: 90 seconds
pkm-review generate --stage final 2026-03-28
- Reads Plan, Log, Health, Diabetes
- Gathers 7 days of context
- Sends to Claude AI
- Generates Day Analysis
- Time: 30 seconds
Total daily automation: ~2 minutes
What Runs Automatically vs Manual
Automatic (runs while making coffee):
- Health data download
- Data normalization
- Chart generation
- Timeline creation
- Neo4j updates
Manual (what I still do):
- Morning review (5 min)
- Manual health notes (3 min)
- Journal reflections (5 min)
The automation handles DATA. I handle MEANING.
Error Handling
When things break (they do):
- API authentication fails → retry with backoff
- PDF download times out → manual fallback
- Neo4j connection drops → queue for sync
- Claude rate limit hit → wait and retry
The system degrades gracefully—never crashes my workflow.
Next, let's talk about costs and tools...
Technical Stack & Monthly Costs
The Tools
Obsidian (Free)
- Markdown editor and PKM platform
- Stores all notes locally
- Plugins: Dataview, Templater, Calendar
Neo4j Desktop (Free)
- Graph database for relationships
- Runs locally on my Mac
- Unlimited nodes (local storage only)
- Full features, no cost, data stays private
Note: Neo4j offers cloud options (Aura, $65+/month) for team collaboration or remote access. I don't need that— Desktop works perfectly for personal use.
Claude AI ($20/month)
- Claude Pro subscription
- Unlimited conversations
- API access for automation
Python (Free)
- Services run locally
- Libraries: requests, playwright, matplotlib
- No hosting costs (runs on my Mac)
Dexcom API (Free)
- Production OAuth2 API
- No usage fees
- Medical device ecosystem
Glooko (Free)
- Browser automation (no API fees)
- Included with Omnipod 5 pump
Total Monthly Cost: $20
- Claude Pro: $20/month
- Neo4j Desktop: Free ✅
- Obsidian: Free ✅
- Python: Free ✅
Optional upgrades:
- Neo4j Aura: $65/month (if you need cloud/teams)
- But I don't—Desktop is plenty!
Why These Choices
Obsidian over Notion:
- Files stored locally (I own my data)
- Markdown (future-proof format)
- Offline-first (works without internet)
Neo4j over PostgreSQL:
- Relationships are first-class citizens
- Cypher queries are readable
- Pattern matching built-in
Claude over ChatGPT:
- Longer context window (200K tokens)
- Better at structured analysis
- API reliability
Local vs Cloud:
- Services run on my Mac (no hosting costs)
- Data stays private (HIPAA-conscious)
- Fast iteration (no deployment delays)
The tools matter less than the architecture. You could rebuild this with different tools—the patterns remain the same.
Next, let's see how it all flows together...
Data Flow - Morning Routine in Action
7:00 AM - Wake Up
- Day cluster already exists (created yesterday for planning).
- Glucose sensor has been collecting data all night (every 5 minutes).
- Omnipod pump recorded every insulin dose.
7:05 AM - Morning Routine
While making coffee, run:
pkm-health sync-full 2026-03-29
Behind the scenes:
- Dexcom API: Fetches 288 glucose readings
- Glooko: Downloads insulin doses (23u total)
- Parser: Merges glucose + insulin + meals
- Generator: Creates Day Diabetes markdown
- Charts: Generates 3 glucose visualizations
- Neo4j: Updates graph with health nodes
- Obsidian: Opens Day Diabetes note
Time elapsed: 90 seconds
7:15 AM - Review Yesterday
- Read Day Diabetes (automated metrics).
- Add manual notes to Day Health (patterns observed).
- Update Day Log (what actually happened).
7:30 AM - Generate Analysis
Run:
pkm-review generate --stage final 2026-03-29
Behind the scenes:
- Reader: Loads Plan, Log, Health, Diabetes
- Context: Gathers previous 6 days
- Claude: Analyzes with PMN framework
- Writer: Generates Day Analysis markdown
- Obsidian: Opens Day Analysis note
Time elapsed: 30 seconds
7:35 AM - Read Insights
- AI spotted 6-day perfect streak.
- AI noted breakfast timing improvement.
- AI suggested evening walk helped dinner spike.
- Total time: 10 minutes (mostly reading)
- Manual data entry: Zero
- Cognitive load: Minimal
The system runs in the background. I focus on living.
What's Next
This is Part 2 of a 5-part AI Diabetes Coach series. You've seen the architecture—now let's go deeper.
💭 Part 3: Prompt Engineering — How to craft prompts that make Claude a genuine diabetes coach that spots patterns rather than a generic chatbot. I share:
- The exact prompt structure I use
- How to provide 7-day context efficiently
- Template for PMN (Plus-Minus-Next) analysis
- Examples of good vs great prompts
- How the AI's coaching evolves as you improve
🕸️ Part 4: Knowledge Graph — Giving AI persistent, queryable memory across months of diabetes data. Neo4j isn't just storage—it's discovery. I'll show:
- Cypher queries for pattern detection
- Temporal analysis across weeks/months
- Correlation discovery (exercise → lows)
- Visual graph exploration
- How to ask questions your database can answer
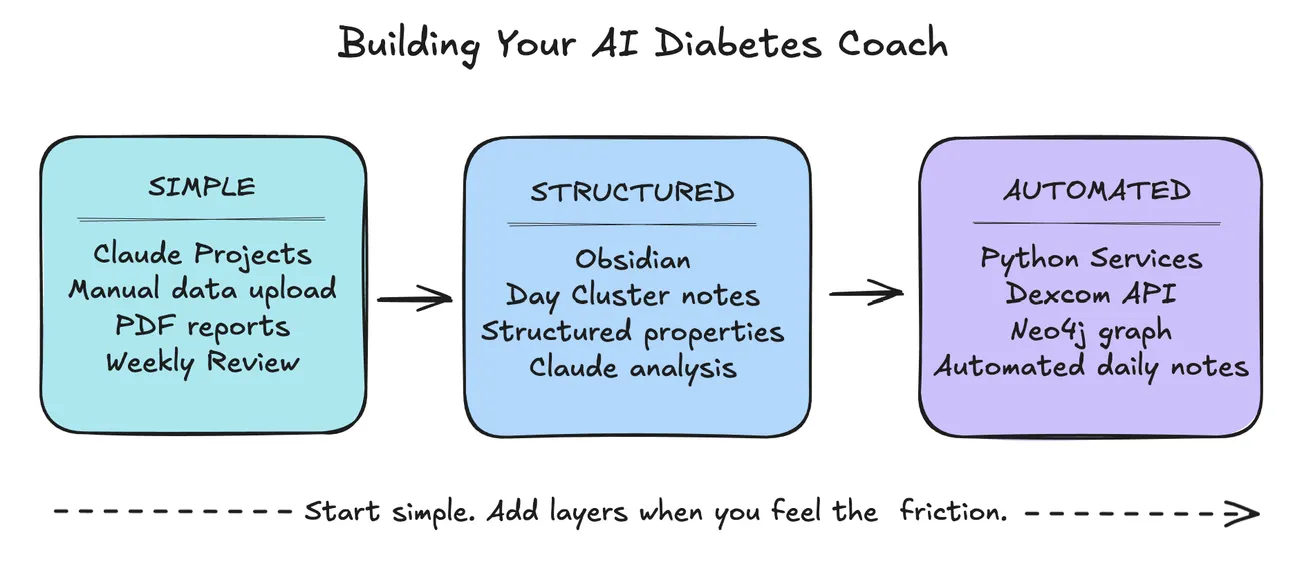
🔧 Part 5: Build Your Own — Whatever your domain (fitness, nutrition, sleep, ADHD, energy):
- Start simple (manual + prompts)
- Add automation gradually
- Tools you can use without coding
- Where to invest time first
- How to adapt this architecture
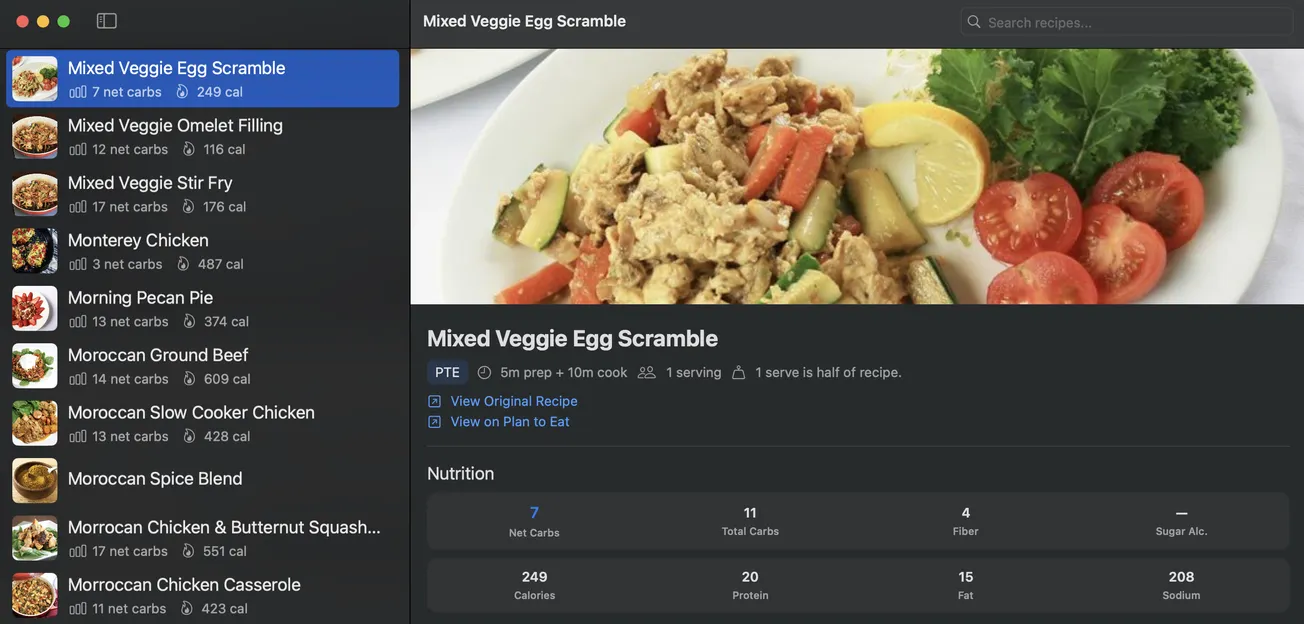
🍴 Part 6: Teaching Your AI Coach to Cook — How food choices connect directly to glucose outcomes — building a recipe intelligence system that learns from your actual responses.
Missed the beginning? Start with 🚀 Part 1: The Transformation
The PKM structure that organizes all this data is covered in a separate series: 📅 Part 1: Day Cluster.
Your Turn
- What domain would YOU apply this to?
- What patterns do you wish you could see?
- What data do you already collect but don't analyze?
Drop a comment—I'd love to hear what you're building.
Want the full series? Subscribe to get posts delivered automatically as they publish.