🤖 AI Diabetes Coach series:
➔ 🚀 Part 1: The Transformation
— 🏗️ Part 2: System Architecture
— 💭 Part 3: Prompt Engineering
— 🕸️ Part 4: Knowledge Graph
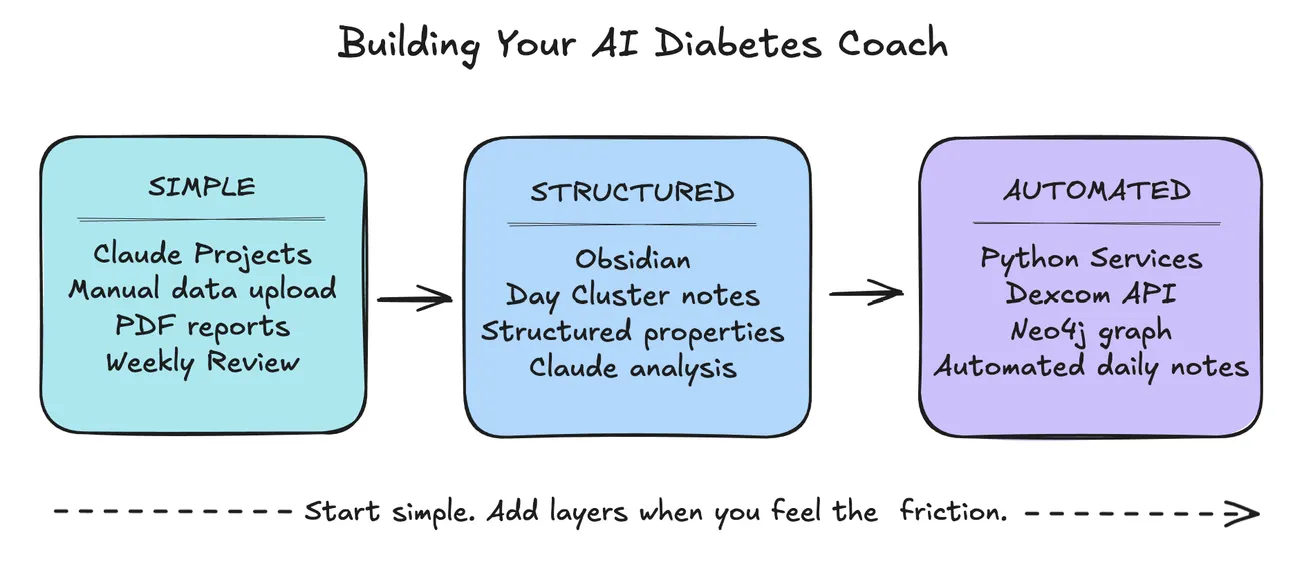
— 🔧 Part 5: Build Your Own
— 🍴 Part 6: Teaching Your AI Coach to Cook
In early February 2026, I was averaging 82% time in glucose range—decent, but not optimal. This week (Week 13, late March 2026), I achieved 98% TIR with five perfect 100% days.
What was the difference? I built an AI-powered PKM system that turns my diabetes data into actionable daily coaching.
Week 13: The Proof
After 6 weeks of building and refining my AI-powered PKM system, here's what one week looked like:
Perfect Days (100% TIR): 5 out of 10 tracked days
- March 17, 21, 22, 24, 26
Excellent Days (95%+ TIR): 4 more days
- March 16, 20, 23, 25
Week Average: 97.1% time in range
Translation: 9 out of 10 days, my glucose stayed in target range 95-100% of the time. Even on "off" days with sensor issues or new equipment, I maintained excellence.
The difference? An AI coach that remembers patterns, celebrates wins, and turns data into actionable insights.
Diabetes Background
I was diagnosed with diabetes 20 years ago. I started wearing a Dexcom continuous glucose monitor (CGM) sensor 6 years ago.
In September 2025, a month before I started with an Omnipod 5 insulin pump (or "pod") to create an automated insulin delivery (AID) system. Previously, I had been taking multiple daily injections (MDI) about 6-7 times every day.
At that time, Dexcom reports showed my average glucose was 185 with a glucose management indictor (GMI) of 7.7% (A1c estimate). My time in range (TIR) between 70-180 was only 54%, and average total daily insulin of 43 units.
Then I integrated my diabetes management with an AI coach into my PKM system. Now for the past 2 weeks, my average glucose is 126 with GMI 6.3%, TIR 96%, Insulin 24, daily carbs at 56, and I've lost 10 pounds!
The Challenge
Type 1 diabetes requires 180+ decisions every day:
- What to eat? (Carb counting for every meal and snack)
- How much insulin? (Dosing calculations 6-10 times daily)
- When to correct? (Responding to highs and lows)
- Why did that happen? (Understanding patterns and causes)
Traditional diabetes apps give me data, but not understanding:
- Dexcom shows glucose readings every 5 minutes (288 data points/day)
- Glooko tracks insulin doses and carbs
- But neither explains WHY my glucose spiked after lunch or HOW to prevent it tomorrow
The problem? Data without context is just noise.
I needed a system that could:
- ✅ Remember yesterday's patterns (and last week's)
- ✅ Connect glucose spikes to specific meals
- ✅ Learn what works (and what doesn't)
- ✅ Coach me with actionable insights
So I built one!
The Transformation
Beyond the Numbers:
Yes, my TIR improved from 54% to 96%. But the real transformation is how I think about diabetes management:
Before (September 2025):
- ❌ Reactive: "Why did I spike? Let me guess..."
- ❌ Isolated: Each day was a fresh start with no memory
- ❌ Time-consuming: Manually reviewing data took hours weekly
- ❌ Inconsistent: Good days felt random, bad days frustrating
- ❌ High insulin needs: 43 units/day
After (March 2026):
- ✅ Proactive: "This meal spiked me last Tuesday, adjust insulin"
- ✅ Contextual: 7-day memory spots patterns I'd miss
- ✅ Automated: Analysis happens automatically every morning
- ✅ Consistent: I know WHY good days work and HOW to replicate them
- ✅ Optimized dosing: 24 units/day (45% reduction!)
Time Savings:
Traditional diabetes management (done well) requires:
- 30-60 min/day analyzing glucose data
- Weekly pattern review sessions
- Monthly report generation
- Constant mental tracking of "what worked"
My system does this automatically while I:
- ✅ Exercise regularly (daily 25-min walks, streak continuing!)
- ✅ Practice meditation (supports glucose stability!)
- ✅ Read more books (freed up mental space!)
- ✅ Build other projects (like this PKM system!)
- ✅ Lost 10 pounds (better nutrition awareness!)
The irony? Building a system to manage diabetes gave me MORE time for life, not less.
What's Next
This post is the beginning of an AI Diabetes Coach series. Here's where we go from here:
- 🏗️ Part 2: System Architecture — The technical stack integrating Dexcom & Glooko diabetes data automation, Python commands and services, Neo4j graph database, Obsidian linked notes, and Claude AI analysis and coaching
- 💭 Part 3: Prompt Engineering — How to craft prompts that make Claude a genuine diabetes coach with pattern recognition and weekly context
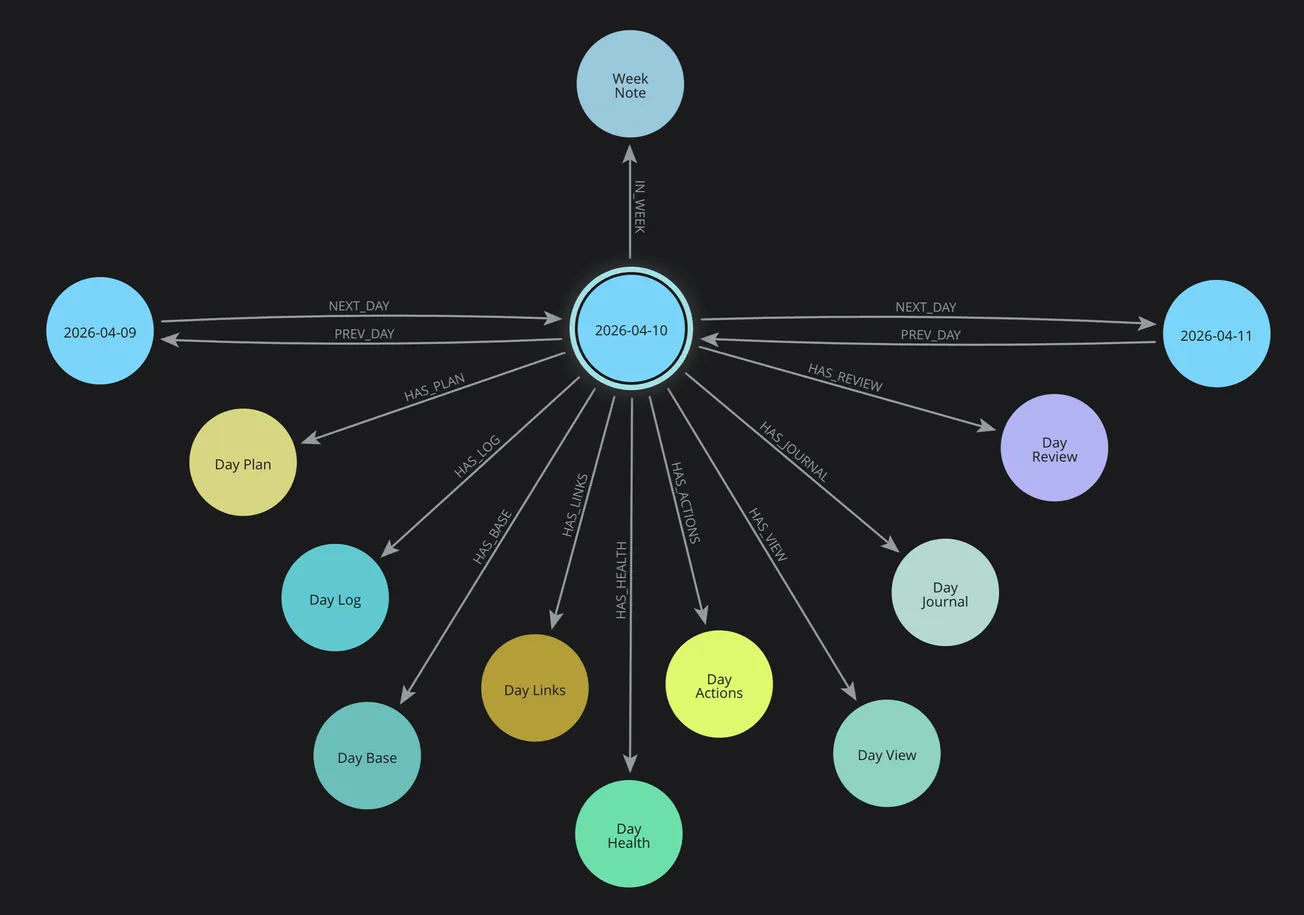
- 🕸️ Part 4: Knowledge Graph — Giving AI persistent, queryable memory across months of diabetes data with Cypher query examples, temporal pattern detection, relationship-based insights, and visual graph exploration
- 🔧 Part 5: Build Your Own — No-code pathway to start today, minimal viable version, tools, costs, and setup, templates and prompts.
- 🍴 Part 6: Teaching Your AI Coach to Cook — How food choices connect directly to glucose outcomes — building a recipe intelligence system that learns from your actual responses.
The PKM structure that organizes all this data is covered in a separate series:
- 📅 Part 1: Day Cluster
📧 Subscribe to get future posts delivered to your inbox!
Plus: Access to comments, digital garden notes, and bonus content.
Join the Conversation
Questions? Tracking health in your PKM? Want to build something similar?
I'm curious to hear:
- What parts of this system would be most valuable for YOUR work?
- Do you track any health/life metrics in your PKM? How?
- What would you want an AI coach to help you with?
For technical folks:
- Interested in the Python code or Neo4j schema?
- Want a deeper dive on the Claude prompt engineering?
For non-technical folks:
- What would make this feel more accessible?
- Which pieces could you implement without coding?
Drop a comment below—I read and respond to every one! 👇
As Nick Milo says: "Your notes should serve your life, not the other way around.
Well I have proved it. My PKM system literally improved my health! 💪
Doug Warren is a PKM practitioner, software developer, and Type 1 diabetes self-advocate with 20+ years of diabetes management experience. He writes about knowledge systems, health technology, and using AI to serve life—not the other way around.
Connect on X or LinkedIn, or follow via ActivityPub at @[email protected].
P.S. This post was written in Obsidian, refined with Claude AI, and will be published across my digital garden, Ghost newsletter, and social channels—all part of the same PKM workflow! Meta, right? 🤯